Unlock a world of possibilities! Login now and discover the exclusive benefits awaiting you.
- Qlik Community
- :
- All Forums
- :
- QlikView App Dev
- :
- Canonical date - duplicated results
- Subscribe to RSS Feed
- Mark Topic as New
- Mark Topic as Read
- Float this Topic for Current User
- Bookmark
- Subscribe
- Mute
- Printer Friendly Page
- Mark as New
- Bookmark
- Subscribe
- Mute
- Subscribe to RSS Feed
- Permalink
- Report Inappropriate Content
Canonical date - duplicated results
hi all,
i am fairly new to Qlikview, and was hoping to get some help on the following question:
i am trying to create a "canonical date" (as reffered in a post which i read), my motivation of doing it is i have 3 different dimension of dates, that i want to insert into a single calendar table, that enables breakdown by creating a flag
I have 3 dates: (the industry is online advertising)
1. Sale date
2. Activation date
3. Click date
the problem is that i see larger results than i have, so i believe i am duplicating results somehow,
i have a feeling it should be on the 3rd load statement,
therefore, i add a distinc, but apperantly it didn't solved it:
Date_Type:
LOAD
JobId,
date(daystart(SaleDate)) as Date,
'SaleDate' as DateType
Resident FactMonthlyConversion;
LOAD
JobId,
date(daystart(ActivationDate)) as Date,
'ActivationDate' as DateType
Resident FactActivations;
LOAD
distinct JobId,
ClickDate as Date,
'ClickDate' as DateType
Resident FactJobPerformance;
- Mark as New
- Bookmark
- Subscribe
- Mute
- Subscribe to RSS Feed
- Permalink
- Report Inappropriate Content
Hi Nir,
What's the expression you're using?
Maybe count(JobId)?
If so, this will result in inflated figures. You should use set analysis to restrict values based on DateType.
For example
count({$<DateType={'SaleDate'}>} JobId)
Marcus
- Mark as New
- Bookmark
- Subscribe
- Mute
- Subscribe to RSS Feed
- Permalink
- Report Inappropriate Content
Hey Marcus, ![]()
basically i am using a sum function,
i am using:
sum({$<DateType={'ClickDate'}>} TotalClicks)
i have a feeling that the problem lays in the script, becuase:
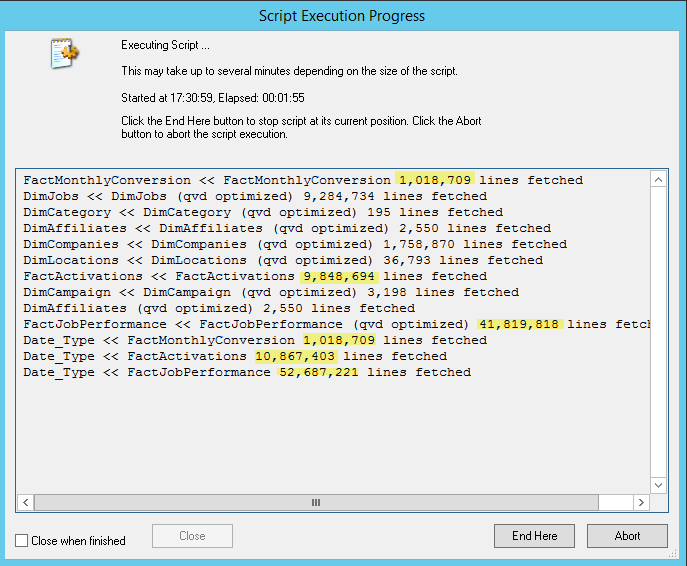
the Date_Type key table is composed from 3 tables:
1. FactMonthlyConversion (1M rows)
2. FactActivations (10M rows)
3. FactJobPerformance (42M rows)but the Date_Type table has is larger than the sum of these (see picture attached)

- Mark as New
- Bookmark
- Subscribe
- Mute
- Subscribe to RSS Feed
- Permalink
- Report Inappropriate Content
The DateType table is ok.
The script is showing a cumulative count of the data.
So 1m for the first load, nearly 11m (1 + 10) for the second, and 52 (1 + 10 + 41) for the third.
Could you upload a reduced data set so I can look at your application?
- Mark as New
- Bookmark
- Subscribe
- Mute
- Subscribe to RSS Feed
- Permalink
- Report Inappropriate Content
thanks for helping
please find attached
in tab "click source", look at the chart, the first expression is the one i am reffering to
- Mark as New
- Bookmark
- Subscribe
- Mute
- Subscribe to RSS Feed
- Permalink
- Report Inappropriate Content
Hi Nir,
had meant to look at this sooner, but have been busy.
I can't see anything fundamentally wrong there, but really I'd need to see some actual data to be sure.
I appreciate you're probably reluctant to share data, so I'd suggest filtering your data so we can see an example of the issue, then using the 'Reduce Data', 'Keep Possible Values' function. Also you might drop some tables, and scramble your data. If you can do this then upload a document containing some data that would be helpful.
Marcus
- Mark as New
- Bookmark
- Subscribe
- Mute
- Subscribe to RSS Feed
- Permalink
- Report Inappropriate Content
Hey Marcus,
although it is not what you requested, but i believe it's pointing the issue with a needle:
when using the canonical dates, things doesn't add up,
so i mananged to isolate a discrepancy,
if you look the file attached, you can see the canonical date dimension isn't translating dates properly,
in the attached:
1. SaleDate is the original date
2. Date is the canonical date
while i am using the script above
Love to hear your thoughts,
Nir
- Mark as New
- Bookmark
- Subscribe
- Mute
- Subscribe to RSS Feed
- Permalink
- Report Inappropriate Content
ok, evidently your conversion is not working properly.
Try
date(Saledate, 'MM/DD/YYYY') as Date
- Mark as New
- Bookmark
- Subscribe
- Mute
- Subscribe to RSS Feed
- Permalink
- Report Inappropriate Content
still not working...