Unlock a world of possibilities! Login now and discover the exclusive benefits awaiting you.
- Qlik Community
- :
- All Forums
- :
- QlikView App Dev
- :
- Re: Case for aggr function?
- Subscribe to RSS Feed
- Mark Topic as New
- Mark Topic as Read
- Float this Topic for Current User
- Bookmark
- Subscribe
- Mute
- Printer Friendly Page
- Mark as New
- Bookmark
- Subscribe
- Mute
- Subscribe to RSS Feed
- Permalink
- Report Inappropriate Content
Case for aggr function?
Hi friends,
I am trying to count distinct number of events per year based on a date, but there is a problem when it is used the regular count ( Distinct "dimension") in expression chart.
Below is the fact table:
| ID | Date | Event | Control |
|---|---|---|---|
| A | 01/01/2015 | X | 1 |
| A | 01/01/2015 | X | 2 |
| A | 01/01/2015 | X | 3 |
| A | 03/07/2015 | X | 1 |
| A | 03/07/2015 | X | 2 |
| B | 02/01/2015 | Z | 1 |
| B | 02/01/2015 | Z | 2 |
| C | 02/10/2015 | X | 1 |
| B | 10/10/2015 | X | 1 |
| B | 10/10/2015 | X | 2 |
So, in this case, when I use the expression Count ( distinct ID), having the dimension year(Date) and Event, the result is:
A = 1
B = 1
C = 1
But the desirable result is:
A = 2
B = 2
C = 1
Does anyone have an idea of what can be done?
Thanks in advance.
- Mark as New
- Bookmark
- Subscribe
- Mute
- Subscribe to RSS Feed
- Permalink
- Report Inappropriate Content
Try count(distinct Date) as expression with ID as dimension
talk is cheap, supply exceeds demand
- Mark as New
- Bookmark
- Subscribe
- Mute
- Subscribe to RSS Feed
- Permalink
- Report Inappropriate Content
Straight Table:
Dim = ID
Exp1 = count(aggr( ID,Date))

- Mark as New
- Bookmark
- Subscribe
- Mute
- Subscribe to RSS Feed
- Permalink
- Report Inappropriate Content
Thanks friends,
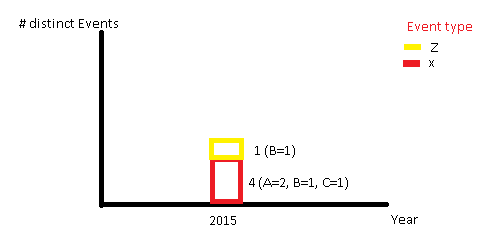
I forgot to include that the result will be shown in a chart like this:
