Unlock a world of possibilities! Login now and discover the exclusive benefits awaiting you.
- Qlik Community
- :
- All Forums
- :
- QlikView App Dev
- :
- Change color in a pivot table
- Subscribe to RSS Feed
- Mark Topic as New
- Mark Topic as Read
- Float this Topic for Current User
- Bookmark
- Subscribe
- Mute
- Printer Friendly Page
- Mark as New
- Bookmark
- Subscribe
- Mute
- Subscribe to RSS Feed
- Permalink
- Report Inappropriate Content
Change color in a pivot table
Dear all
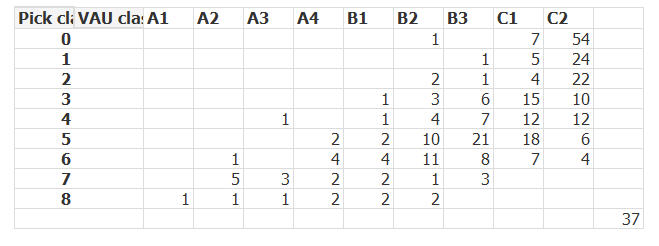
I have a question how to change color in a pivot table.
This is how the table is looking now.
How do I do to change it like this:

Thanks in advance
Markus
- Tags:
- new_to_qlikview
Accepted Solutions
- Mark as New
- Bookmark
- Subscribe
- Mute
- Subscribe to RSS Feed
- Permalink
- Report Inappropriate Content
Hi,
See the attached file there i do some changes for Background Color and Text Color like
For Background - if(count([Count of Material number])>1,RGB(255,0,0),RGB(196,255,255))
For Text Color - if(count([Count of Material number])>1,White(),Black())
The above condition is for check it depends on you how you want to display.
Regards,
Anand
- Mark as New
- Bookmark
- Subscribe
- Mute
- Subscribe to RSS Feed
- Permalink
- Report Inappropriate Content
Hi,
It depend on your condition you are able to change the color of the Background by following code
in background like
if(Count( if(Your Condition))>=2,RGB(255,0,0),RGB(196,255,255))
Do you have any sample
Regards,
Anand
- Mark as New
- Bookmark
- Subscribe
- Mute
- Subscribe to RSS Feed
- Permalink
- Report Inappropriate Content
Hi,
You need to go your Expression and click plus button after that click on button and type code there =if(Count( if(Your Condition))>=2,RGB(255,0,0),RGB(196,255,255)) it is a sample code.
Regards,
Anand
- Mark as New
- Bookmark
- Subscribe
- Mute
- Subscribe to RSS Feed
- Permalink
- Report Inappropriate Content
Hi
I have now uploaded an example,
could you please help me? I didn´t follow you
Thanks
Markus
- Mark as New
- Bookmark
- Subscribe
- Mute
- Subscribe to RSS Feed
- Permalink
- Report Inappropriate Content
Hi,
See the attached file there i do some changes for Background Color and Text Color like
For Background - if(count([Count of Material number])>1,RGB(255,0,0),RGB(196,255,255))
For Text Color - if(count([Count of Material number])>1,White(),Black())
The above condition is for check it depends on you how you want to display.
Regards,
Anand
- Mark as New
- Bookmark
- Subscribe
- Mute
- Subscribe to RSS Feed
- Permalink
- Report Inappropriate Content
Hi,
It is correct that i suggest you.
Regards,
Anand
- Mark as New
- Bookmark
- Subscribe
- Mute
- Subscribe to RSS Feed
- Permalink
- Report Inappropriate Content
Great! Thanks
how do I do the line border in different colors?
I have a "red-box" in my example
BR Markus
- Mark as New
- Bookmark
- Subscribe
- Mute
- Subscribe to RSS Feed
- Permalink
- Report Inappropriate Content
MMeijer wrote:
how do I do the line border in different colors?
You don't. You can change all of them using one of the styles on the style tab, or by going to settings -> user preferences -> design -> checkmark "always show design menu items", then right clicking on a cell, selecting "custom format cell", and fiddling around with the border colors there. But it won't do what you want it to do because it's not changing that specific cell, but rather rows and columns in the chart.