Unlock a world of possibilities! Login now and discover the exclusive benefits awaiting you.
- Qlik Community
- :
- All Forums
- :
- QlikView App Dev
- :
- Change the slide direction
- Subscribe to RSS Feed
- Mark Topic as New
- Mark Topic as Read
- Float this Topic for Current User
- Bookmark
- Subscribe
- Mute
- Printer Friendly Page
- Mark as New
- Bookmark
- Subscribe
- Mute
- Subscribe to RSS Feed
- Permalink
- Report Inappropriate Content
Change the slide direction
I created a scatter plot in order to represent the quality of a product related to its price. To do so, I calculated two indicators which values are between -1 and 1. In order to show the best products (low price and best quality), I put two slides on which you could choose an interval between -1 and 1.
But, if the horizontal slide is in the right order (-1 on the left, 1 on the right), it is not the same for the vertical slide (-1 up and 1 down).
Is it possible to put the slide the other way ?
- Tags:
- slider_object
- Mark as New
- Bookmark
- Subscribe
- Mute
- Subscribe to RSS Feed
- Permalink
- Report Inappropriate Content
it'll be easier if you post a qvw sample
- Mark as New
- Bookmark
- Subscribe
- Mute
- Subscribe to RSS Feed
- Permalink
- Report Inappropriate Content
Hi Stefaan,
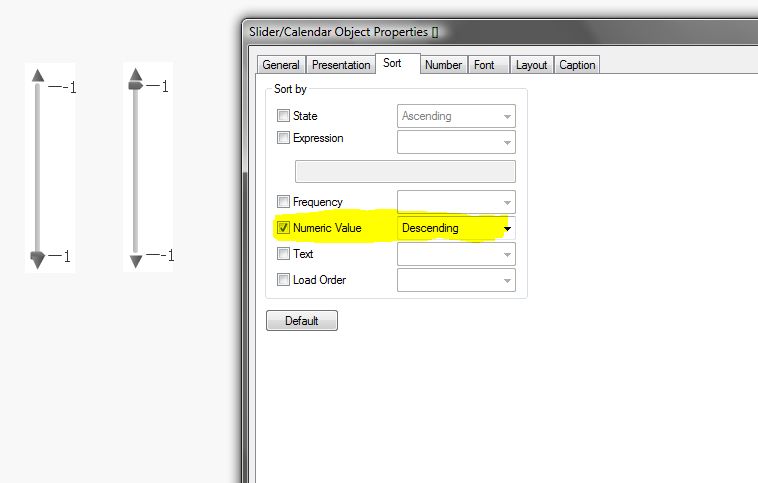
Did you try to sort on Numeric Value?
See attachment.
Good Luck,
Dennis.
- Mark as New
- Bookmark
- Subscribe
- Mute
- Subscribe to RSS Feed
- Permalink
- Report Inappropriate Content
Hi,
I'm hitting this problem now, but the Sort tab is disabled.
Please see sample.
Regards,
Jonathan
- Mark as New
- Bookmark
- Subscribe
- Mute
- Subscribe to RSS Feed
- Permalink
- Report Inappropriate Content
Sort disabled because you use variable and directly assign min and max values.
In other words - there is nothing to sort.
Consider creating a field with corresponding numeric values in the load script.
Then use this field instead of your variable.
In this case you can use sorting.
- Mark as New
- Bookmark
- Subscribe
- Mute
- Subscribe to RSS Feed
- Permalink
- Report Inappropriate Content
Hi WL,
Thanks for this. I've got something working. I am having to preset the field values behind the sliders by either creating (then deleting) a listbox with always one selected, or by adding a trigger to the sheet to set a field value. I'm also now cluttering up my Current selectons field with up to 8 slider values.
Deciding now whether it's worth dealing with these issues in order to show the negative options of a slider below the positive ones. Might just flip them to horizontal instead.
Regards,
Jonathan
- Mark as New
- Bookmark
- Subscribe
- Mute
- Subscribe to RSS Feed
- Permalink
- Report Inappropriate Content
The horizontal orientation is perfect for time values while vertical for zoom 
As for the case itself, I prefer to use the solution with separate field as more common and easily extensible (dual, sorting and so on).