Unlock a world of possibilities! Login now and discover the exclusive benefits awaiting you.
- Qlik Community
- :
- All Forums
- :
- QlikView App Dev
- :
- Re: Chart Layout
- Subscribe to RSS Feed
- Mark Topic as New
- Mark Topic as Read
- Float this Topic for Current User
- Bookmark
- Subscribe
- Mute
- Printer Friendly Page
- Mark as New
- Bookmark
- Subscribe
- Mute
- Subscribe to RSS Feed
- Permalink
- Report Inappropriate Content
Chart Layout
Hi Guys,
I am working with 3 fields, ID, DATE and A COUNT DIMENSION.
ID and Date are both dimensions as IDs have multiple dates.
The Dimension is a count of another field.
Is there anyway to set the table up on QLIK so it would look like below? (Similar to how you can work with a pivot table on excel
| DATE1 | DATE2 | DATE3 | DATE4 | |
| ID 1 | X | X | X | X |
| ID 2 | X | X | X | X |
| ID 3 | X | X | X | X |
| ID 4 | X | X | X | X |
With X being the returned Count Expression values.
Currently the chart looks like this:
| DATE | ID | COUNT |
| DATE1 | ID1 | X |
| DATE2 | ID2 | X |
| DATE3 | ID3 | X |
| DATE4 | ID4 | X |
I've tried the horizontal function on the presentation tab but this is not the answer.
Accepted Solutions
- Mark as New
- Bookmark
- Subscribe
- Mute
- Subscribe to RSS Feed
- Permalink
- Report Inappropriate Content
Hi Tim,
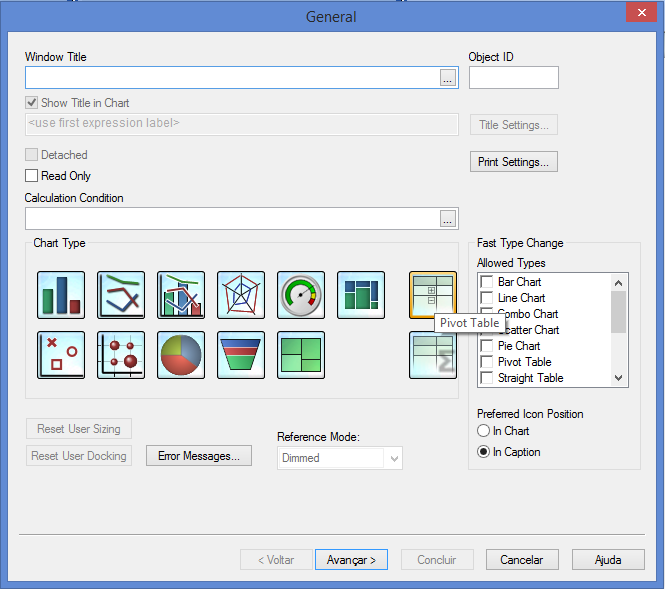
Select pivot table under charts

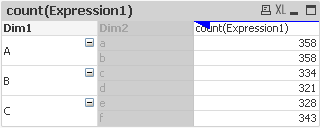
then click and drag the column name to the side until you see the arrow as below

Hope it helps,
Fernando
- Mark as New
- Bookmark
- Subscribe
- Mute
- Subscribe to RSS Feed
- Permalink
- Report Inappropriate Content
Hi,
Create a Pivot Table and move the Date column to Horizontal Tab heading.
- Mark as New
- Bookmark
- Subscribe
- Mute
- Subscribe to RSS Feed
- Permalink
- Report Inappropriate Content
May be use Pivot table here and pivot the Date dimension:
- Mark as New
- Bookmark
- Subscribe
- Mute
- Subscribe to RSS Feed
- Permalink
- Report Inappropriate Content
Please refer the attached qvw.
- Mark as New
- Bookmark
- Subscribe
- Mute
- Subscribe to RSS Feed
- Permalink
- Report Inappropriate Content
Hi Tim,
Select pivot table under charts

then click and drag the column name to the side until you see the arrow as below

Hope it helps,
Fernando
- Mark as New
- Bookmark
- Subscribe
- Mute
- Subscribe to RSS Feed
- Permalink
- Report Inappropriate Content
Perfect - Thank you