Unlock a world of possibilities! Login now and discover the exclusive benefits awaiting you.
Announcements
Join us to spark ideas for how to put the latest capabilities into action. Register here!
- Qlik Community
- :
- All Forums
- :
- QlikView App Dev
- :
- Re: Chart Properties, Top 10 by value
Options
- Subscribe to RSS Feed
- Mark Topic as New
- Mark Topic as Read
- Float this Topic for Current User
- Bookmark
- Subscribe
- Mute
- Printer Friendly Page
Turn on suggestions
Auto-suggest helps you quickly narrow down your search results by suggesting possible matches as you type.
Showing results for
Creator III
2015-03-20
10:08 AM
- Mark as New
- Bookmark
- Subscribe
- Mute
- Subscribe to RSS Feed
- Permalink
- Report Inappropriate Content
Chart Properties, Top 10 by value
Hi All,
As the subject suggests, how do I format my Chart Properties by Top 10 only?
Best,
Stephen
- Tags:
- new_to_qlikview
987 Views
9 Replies
Anonymous
Not applicable
2015-03-20
10:10 AM
- Mark as New
- Bookmark
- Subscribe
- Mute
- Subscribe to RSS Feed
- Permalink
- Report Inappropriate Content
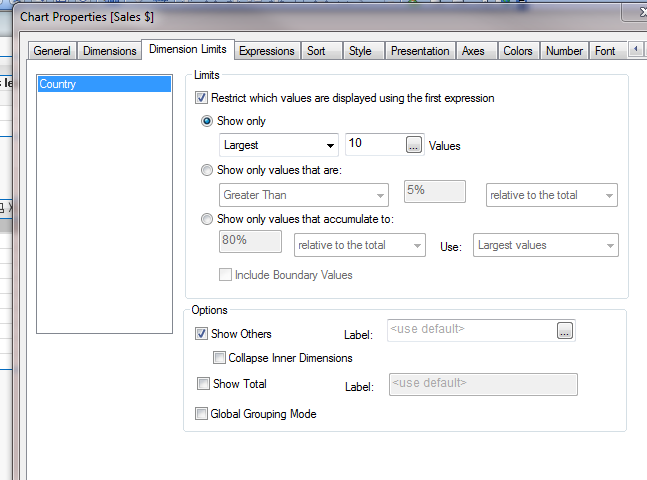
Have look at the Dimension Limits tab of your Chart
722 Views
Partner - Champion
2015-03-20
12:11 PM
- Mark as New
- Bookmark
- Subscribe
- Mute
- Subscribe to RSS Feed
- Permalink
- Report Inappropriate Content
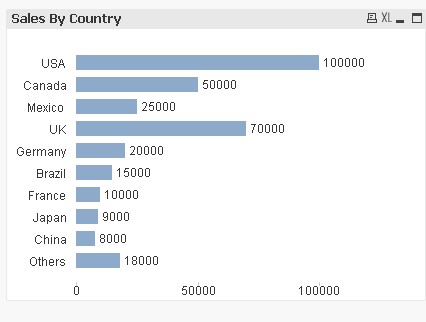
Hi Steven,
please see the attached example using dimension limits
Andy
722 Views
Master II
2015-03-20
12:15 PM
- Mark as New
- Bookmark
- Subscribe
- Mute
- Subscribe to RSS Feed
- Permalink
- Report Inappropriate Content
try this,
on ur chart properties --> Dimension Limits -Show only -Largest 10
722 Views
Anonymous
Not applicable
2015-03-20
01:07 PM
- Mark as New
- Bookmark
- Subscribe
- Mute
- Subscribe to RSS Feed
- Permalink
- Report Inappropriate Content
722 Views
Creator III
2015-03-20
01:52 PM
Author
- Mark as New
- Bookmark
- Subscribe
- Mute
- Subscribe to RSS Feed
- Permalink
- Report Inappropriate Content
Hi all,
Its chart properties when Pivot Table is selected not a graph, any other suggestions?
Thank you.
722 Views
Creator III
2015-03-20
01:53 PM
Author
- Mark as New
- Bookmark
- Subscribe
- Mute
- Subscribe to RSS Feed
- Permalink
- Report Inappropriate Content
Hi Bill,
It is a pivot table in chart properties, is this still possible?
722 Views
Partner - Creator III
2015-03-20
03:50 PM
- Mark as New
- Bookmark
- Subscribe
- Mute
- Subscribe to RSS Feed
- Permalink
- Report Inappropriate Content
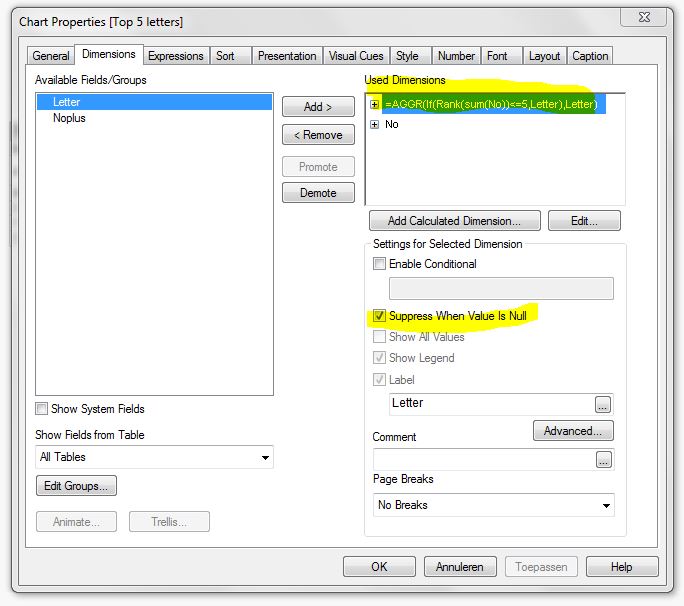
Hi Stephen,
Look at the calculated dimension and uncheck 'Suppress When Value Is null' (see attchm).
And change the <=5 to <=10 🙂
Grtz. Fred
722 Views
Anonymous
Not applicable
2015-03-20
03:56 PM
- Mark as New
- Bookmark
- Subscribe
- Mute
- Subscribe to RSS Feed
- Permalink
- Report Inappropriate Content
Anonymous
Not applicable
2015-03-20
05:08 PM
- Mark as New
- Bookmark
- Subscribe
- Mute
- Subscribe to RSS Feed
- Permalink
- Report Inappropriate Content
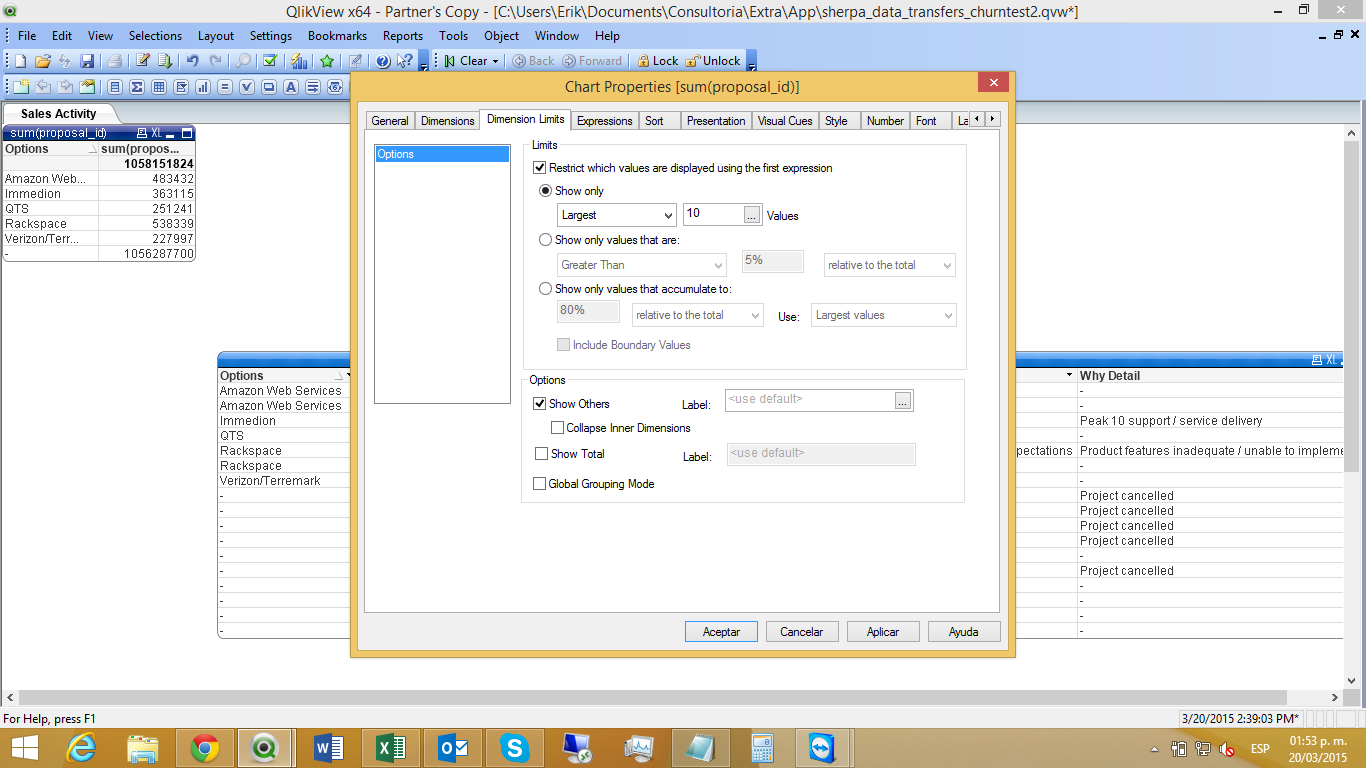
Maybe this help you
722 Views