Unlock a world of possibilities! Login now and discover the exclusive benefits awaiting you.
- Qlik Community
- :
- All Forums
- :
- QlikView App Dev
- :
- Re: Re: Chart Visibility Based on Selected Value?
- Subscribe to RSS Feed
- Mark Topic as New
- Mark Topic as Read
- Float this Topic for Current User
- Bookmark
- Subscribe
- Mute
- Printer Friendly Page
- Mark as New
- Bookmark
- Subscribe
- Mute
- Subscribe to RSS Feed
- Permalink
- Report Inappropriate Content
Chart Visibility Based on Selected Value?
Hello Everyone,
Can you please help into this:
I have three buttons, like by city, by region and by country, when i click on the city the table with ( City + col 1 + col 2) should show, same like other buttons. This is fine,
I have one more table like Month+Col1+Col2, This table should show when i select the particular moth in the list box.
Please suggest me how to achieve this based on the selected value in list box.
Thank you in advance
- Tags:
- new-to-qlikview
- « Previous Replies
-
- 1
- 2
- Next Replies »
Accepted Solutions
- Mark as New
- Bookmark
- Subscribe
- Mute
- Subscribe to RSS Feed
- Permalink
- Report Inappropriate Content
I just did it, This is the way i want
Thank you all for your responses
- Mark as New
- Bookmark
- Subscribe
- Mute
- Subscribe to RSS Feed
- Permalink
- Report Inappropriate Content
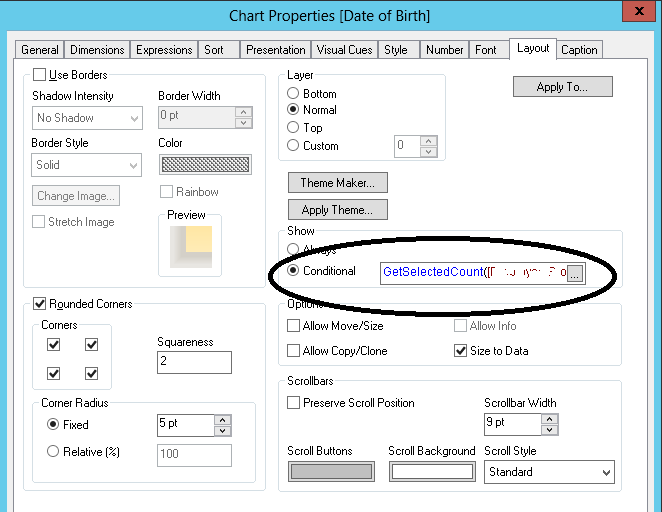
Go to chart properties
Layout tab
Show >> Conditional
Enter below expression
GetSelectedCount(Month)>0
- Mark as New
- Bookmark
- Subscribe
- Mute
- Subscribe to RSS Feed
- Permalink
- Report Inappropriate Content
Use this:
=GetSelectedCount(Write The Name of the field you are using in List Box on whose Selction you want to Show the table(Month+Col1+Col2),1)
Your Syntax should be like this:
=GetSelectedCount(FieldName,1)
See the Snapshot to see where to add the conditional Expression:
Regards
Aviral Nag
- Mark as New
- Bookmark
- Subscribe
- Mute
- Subscribe to RSS Feed
- Permalink
- Report Inappropriate Content
Hello Aviral,
Thanks for your response, I tried it, but i am getting below attached error, Please look into this
- Mark as New
- Bookmark
- Subscribe
- Mute
- Subscribe to RSS Feed
- Permalink
- Report Inappropriate Content
See the Attachment.
- Mark as New
- Bookmark
- Subscribe
- Mute
- Subscribe to RSS Feed
- Permalink
- Report Inappropriate Content
Hi Sreeharhsa,
you have entered the calculation condition on the general tab, instead of the layout tab show condition (shown in Nag's screenshot)
- Mark as New
- Bookmark
- Subscribe
- Mute
- Subscribe to RSS Feed
- Permalink
- Report Inappropriate Content
I got it Nag, it is working with your reply, Thanks
when i clicked on the month from list box table is showing, but if i click on City button the month chart is not showing,
Please help me in that
- Mark as New
- Bookmark
- Subscribe
- Mute
- Subscribe to RSS Feed
- Permalink
- Report Inappropriate Content
You can use Multiple conditions:
GetSelectedCount(Month,1) OR GetSelectedCount(City,1)
- Mark as New
- Bookmark
- Subscribe
- Mute
- Subscribe to RSS Feed
- Permalink
- Report Inappropriate Content
Hi,
plese find the attached file
i hope it will help you
- Mark as New
- Bookmark
- Subscribe
- Mute
- Subscribe to RSS Feed
- Permalink
- Report Inappropriate Content
Hello Nag,
I will give you details information: Please help
When i click on the City button: The table is showing like below:
City RoomSold Revenue
XXX 234 1234
When i click on the Country button: The table is showing like below:
City RoomSold Revenue
YY 234 1234
here i used condition like this vviewmode=City to show and hide by button< the chart should show in the same place
Now i have one list box, Lets say Region, if click on any value in the list box, the chart should appear having below values
Month RoomSold Revenue
Jan 123 2343
Feb 123 132431
till this i am done
now the problem is when i click on city my city chart is not showing
Thanks
- « Previous Replies
-
- 1
- 2
- Next Replies »