Unlock a world of possibilities! Login now and discover the exclusive benefits awaiting you.
- Qlik Community
- :
- All Forums
- :
- QlikView App Dev
- :
- Re: Chart properties enable conditional under dime...
- Subscribe to RSS Feed
- Mark Topic as New
- Mark Topic as Read
- Float this Topic for Current User
- Bookmark
- Subscribe
- Mute
- Printer Friendly Page
- Mark as New
- Bookmark
- Subscribe
- Mute
- Subscribe to RSS Feed
- Permalink
- Report Inappropriate Content
Chart properties enable conditional under dimension tab
Hi:
Can anyone make me understand, how the enable conditional work in Chart. For me , I would like to restrict few materials not to appear on the report based on certain condition, can it be achievable?
E.g. I would like tp bring up only those materials who has an associated PO for current Year or previous Year.
Any help would be highly appreciated.
Thanks & Regards,
Bimala
- Tags:
- new_to_qlikview
- Mark as New
- Bookmark
- Subscribe
- Mute
- Subscribe to RSS Feed
- Permalink
- Report Inappropriate Content
Hi,
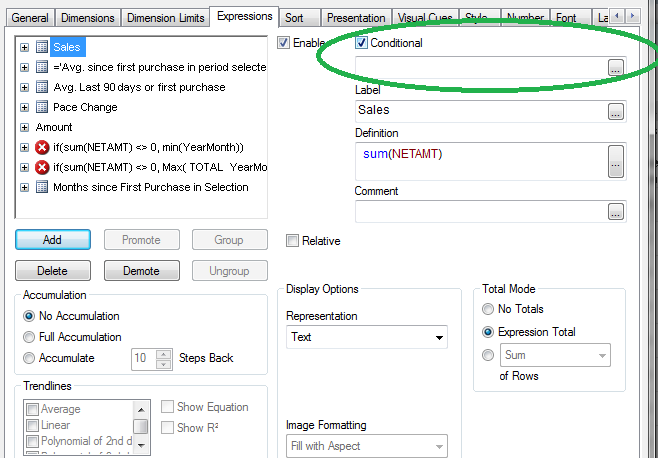
Enable Conditional helps us in dynamic show/hide of the dimension in the chart. Can you some sample file, so that it would be easier to provide solution.
Regards,
Jagan.
- Mark as New
- Bookmark
- Subscribe
- Mute
- Subscribe to RSS Feed
- Permalink
- Report Inappropriate Content
if its on the Expression basis than you can use conditional expression in this case you can write your condition in that and it will work according to that

- Mark as New
- Bookmark
- Subscribe
- Mute
- Subscribe to RSS Feed
- Permalink
- Report Inappropriate Content
If I understood correctly, I think you are looking for calculated dimension rather than condition. You can filter out some dimension values by expression in calculated dimension.
- Mark as New
- Bookmark
- Subscribe
- Mute
- Subscribe to RSS Feed
- Permalink
- Report Inappropriate Content
As i under stand you can use the SET analysis to include some set of records and exclude some set of records.
- Mark as New
- Bookmark
- Subscribe
- Mute
- Subscribe to RSS Feed
- Permalink
- Report Inappropriate Content
Hi Bimala,
For your requirement, you have to give set modifier in expression. There will be no need of Enable Condition.
But for your knowledge, Enable condition is for just hiding and showing the chart as per the requirement. Generally we use enable condition to show 2 different charts at same place, faking as a single chart is showing 2 different things.
- Mark as New
- Bookmark
- Subscribe
- Mute
- Subscribe to RSS Feed
- Permalink
- Report Inappropriate Content
Enable Condition is used to show/hide chart/tables based on certain condition.
Something like... if you want chart to be shown only if total qty is > 1000.. you can use SUM(Qty) >= 1000
To restrict some values from specific field, you need to use set analysis.
Consider that you have below script..
Load * Inline
[
Customer, Item, Qty
A, Apple, 100
A, Orange, 50
A, Banana, 40
B, Apple, 70
B, Orange, 20
B, Grapes, 140
C, Apple, 110
C, Grapes, 60
D, Cherry, 90
D, Apple, 120
E, Orange, 80
E, Banana, 45
F, Cherry, 100
];
Create a straight table
Dimension = Customer
Expressions
Total Qty purchased by Customer
SUM(Qty)
Total Apple Purchased
SUM({<Item = {'Apple'}>}Qty)
Total Apple and Cherry Purchased
SUM({<Item = {'Apple','Cherry'}>}Qty)
Total Qty Purchased except Apple
SUM({<Item -= {'Apple'}>}Qty)
Total Qty Purchased for customers who have purchased Apple Also
SUM({<Customer = P({1<Item = {'Apple'}>})>}Qty)
Total Qty Purchased for customers who haven't purchased Apple
SUM({<Customer = E({1<Item = {'Apple'}>})>}Qty)
Hope this will help...
- Mark as New
- Bookmark
- Subscribe
- Mute
- Subscribe to RSS Feed
- Permalink
- Report Inappropriate Content
Hi:
I am hereby attaching the qvw. My requirement is to restrict certain materials to appear in the chart based on certain condition. Refer Report sheet. Unit Price Comparison report (2012-2013), Can see few materials who does not have any value but still appears
The condition used is
IF
(len(PO_2013) <> 0 OR len(PO_2012) <>0,MATNR,Null())
So putting NULL value, when the condition not satisfied.
And enable the button suppress null values check box.
Thanks & Regards,
Bimala
- Mark as New
- Bookmark
- Subscribe
- Mute
- Subscribe to RSS Feed
- Permalink
- Report Inappropriate Content
Hi,
Try this three as dimensions
=IF(len(PO_2013) <> 0 OR len(PO_2012) <>0,WERKS,Null())
=IF(len(PO_2013) <> 0 OR len(PO_2012) <>0,MATNR,Null())
=IF(len(PO_2013) <> 0 OR len(PO_2012) <>0,MAKTX,Null())
Regards,
Jagan.