Unlock a world of possibilities! Login now and discover the exclusive benefits awaiting you.
- Qlik Community
- :
- All Forums
- :
- QlikView App Dev
- :
- Re: Chart show Values for only one segment on top ...
- Subscribe to RSS Feed
- Mark Topic as New
- Mark Topic as Read
- Float this Topic for Current User
- Bookmark
- Subscribe
- Mute
- Printer Friendly Page
- Mark as New
- Bookmark
- Subscribe
- Mute
- Subscribe to RSS Feed
- Permalink
- Report Inappropriate Content
Chart show Values for only one segment on top of data points
Dear friends and community members,
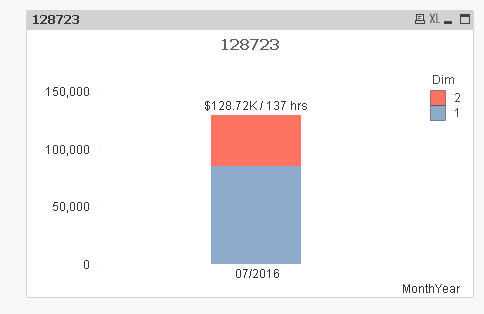
I am concating values / results from two aggr. functions and trying to display customized result (in a specific format) on top of bar as values on data points but it is showing values for only one segment (largest segment) rather than showing the consolidated sum of all the segment.
For example: when i just do simple sum([TOV]), it shows correctly i.e. 128.72 = 84.92 + 43.80


But when i do it with expression '$' & (Sum([TOV])/1000) &'K / '& (sum([FUNDED_HRS])) & 'hrs' like mentioned above in the thread, it shows value for only one segement i.e. 84.92 . deosn't include the value of yellow segment in this case. any idea ?

More details on my issue can be found on this question which has been marked as answered and I was advised to put a separate question for this issue!. https://community.qlik.com/message/1196368?et=watches.email.thread#1196368
Thank you in advance for your kind help.
Gaurav
- « Previous Replies
-
- 1
- 2
- Next Replies »
- Mark as New
- Bookmark
- Subscribe
- Mute
- Subscribe to RSS Feed
- Permalink
- Report Inappropriate Content
You just want the total at the top? May be this
Num(Sum(TOTAL <MonthYear> [TOV]/1000), '$#,##0.00K / ') & (Num(Sum(TOTAL <MonthYear> [FUNDED_HRS]), '##. hrs'))
- « Previous Replies
-
- 1
- 2
- Next Replies »