Unlock a world of possibilities! Login now and discover the exclusive benefits awaiting you.
- Qlik Community
- :
- All Forums
- :
- QlikView App Dev
- :
- Re: Charts showing missing data (with test qvw)
- Subscribe to RSS Feed
- Mark Topic as New
- Mark Topic as Read
- Float this Topic for Current User
- Bookmark
- Subscribe
- Mute
- Printer Friendly Page
- Mark as New
- Bookmark
- Subscribe
- Mute
- Subscribe to RSS Feed
- Permalink
- Report Inappropriate Content
Charts showing missing data (with test qvw)
Hi Community,
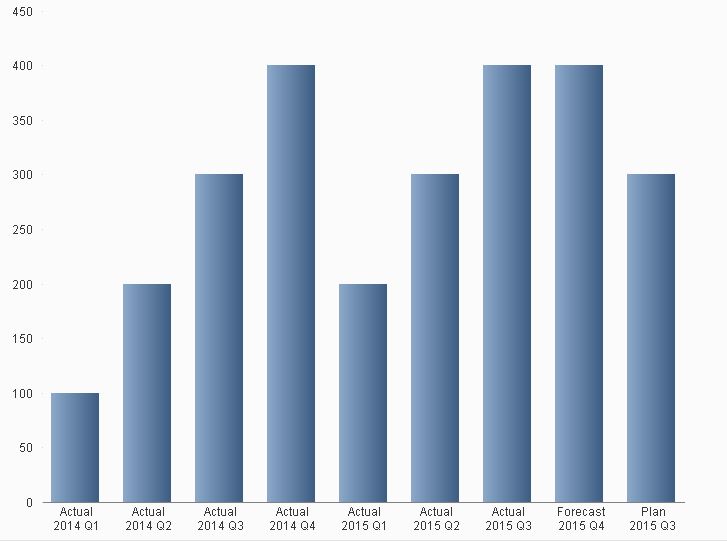
I am now doing a dashboard that shows the actual, plan and forecast data. Users are required to select a Year and a Quarter. The bar chart will then present the figures of:
1. Prior Year Actual
2. Current Year Actual till the Quarter being selected
3. Current Year Forecast after the Quarter being selected
4.Current Year Plan for the Quarter being selected
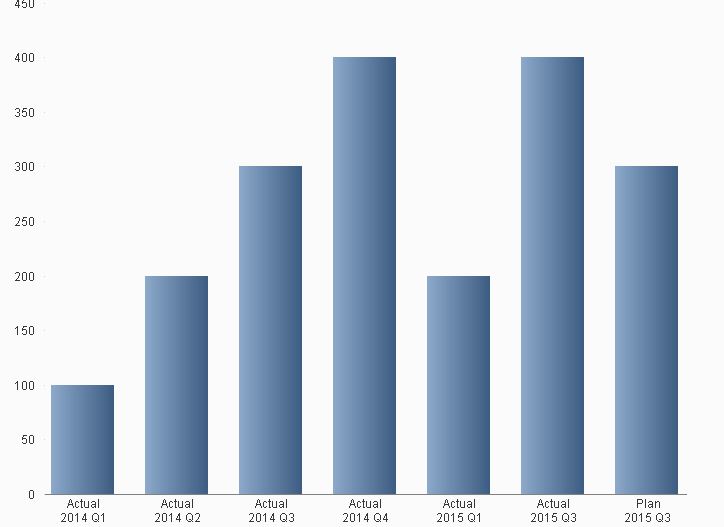
I have encountered a problem when there is missing records from the data source, the corresponding bars will also be missing. What I want is showing 0 by leaving a vacant space for those missing data. How can I achieve this?
Expected Result:
Result With Missing Data:
Thanks,
Maverick
Accepted Solutions
- Mark as New
- Bookmark
- Subscribe
- Mute
- Subscribe to RSS Feed
- Permalink
- Report Inappropriate Content
I think this will be helpful: Re: Control Bar width in Bar Chart
- Marcus
- Mark as New
- Bookmark
- Subscribe
- Mute
- Subscribe to RSS Feed
- Permalink
- Report Inappropriate Content
I think this will be helpful: Re: Control Bar width in Bar Chart
- Marcus
- Mark as New
- Bookmark
- Subscribe
- Mute
- Subscribe to RSS Feed
- Permalink
- Report Inappropriate Content
Thanks Marcus!
Basically, I just need to add 0 records by expression with set analysis to achieve the expected result.
Thanks a lot!
P.S. I am now trying to apply this method for some line charts to see if it works as well. Gonna update the status later.