Unlock a world of possibilities! Login now and discover the exclusive benefits awaiting you.
- Qlik Community
- :
- All Forums
- :
- QlikView App Dev
- :
- Re: Cohort Analysis
- Subscribe to RSS Feed
- Mark Topic as New
- Mark Topic as Read
- Float this Topic for Current User
- Bookmark
- Subscribe
- Mute
- Printer Friendly Page
- Mark as New
- Bookmark
- Subscribe
- Mute
- Subscribe to RSS Feed
- Permalink
- Report Inappropriate Content
Cohort Analysis
Hi Community,
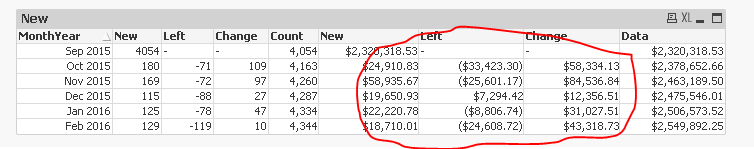
I need to do a Cohort Analysis. Primarily I'm trying to work out the difference with the dollar amounts I'm very grateful to Sunny for providing insights on this report thus far.
Please provide assistance,
- Mark as New
- Bookmark
- Subscribe
- Mute
- Subscribe to RSS Feed
- Permalink
- Report Inappropriate Content
Hi Sunny,
Do you've any further insights?
- Mark as New
- Bookmark
- Subscribe
- Mute
- Subscribe to RSS Feed
- Permalink
- Report Inappropriate Content
Hi Khushal,
Amazing work! I'm mesmerized. For some odd reason I can't open the Test QVW above it fails after it finishes downloading.
- Mark as New
- Bookmark
- Subscribe
- Mute
- Subscribe to RSS Feed
- Permalink
- Report Inappropriate Content
Kush, I am unable to open it as well. Can you repost it
- Mark as New
- Bookmark
- Subscribe
- Mute
- Subscribe to RSS Feed
- Permalink
- Report Inappropriate Content
Lets wait and check if Kush's solution does what you are looking for. If it does, then you won't need my help any more 
- Mark as New
- Bookmark
- Subscribe
- Mute
- Subscribe to RSS Feed
- Permalink
- Report Inappropriate Content
Hi Sunny,
Do you've any updates?
- Mark as New
- Bookmark
- Subscribe
- Mute
- Subscribe to RSS Feed
- Permalink
- Report Inappropriate Content
Is what Kush provided not the right result you are expecting? If it isn't, I can start looking at his results and start making changes there
- Mark as New
- Bookmark
- Subscribe
- Mute
- Subscribe to RSS Feed
- Permalink
- Report Inappropriate Content
Only because Kush is not available, I am going to post my version of his code. All credit to him for getting this to work.
- Mark as New
- Bookmark
- Subscribe
- Mute
- Subscribe to RSS Feed
- Permalink
- Report Inappropriate Content
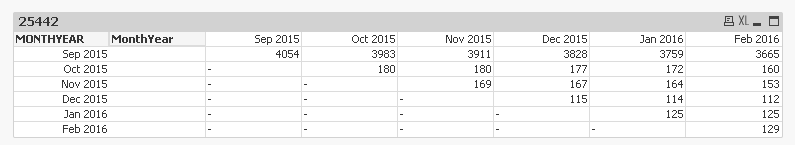
His scripting is ridiculously phenomenal but there's this little issue with the highlighted numbers. Up to Nov the numbers are great but once we hit Dec; the Sep-15 numbers are getting calculated twice. 3910 - 88 is 3822 but what the formula (I don't know since I can't open the test QVW) is doing its also subtracting the customers we lost from Oct and Nov (180 - 3 = 177 and 169 - 2 = 167) into 3822 + 5 (3 from Oct and 2 from Nov) tallies 3827 total customers lost. This trend continues until Feb 2016.
The table should be somewhat like below.
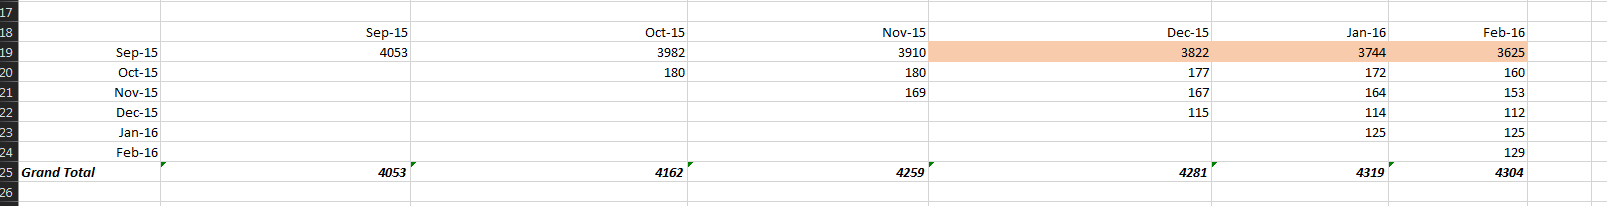
Please provide assistance!!!!!!!!
- Mark as New
- Bookmark
- Subscribe
- Mute
- Subscribe to RSS Feed
- Permalink
- Report Inappropriate Content
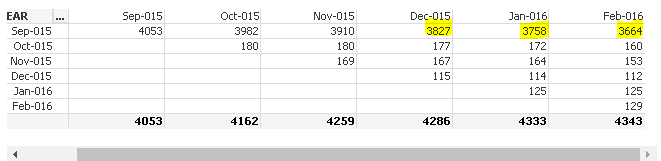
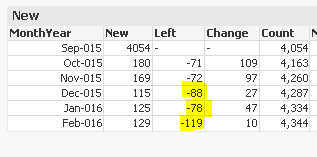
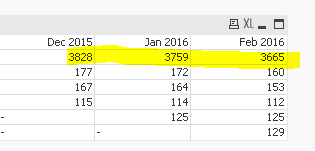
Thanks Sunny but the same issue exists here (from Dec) the top number also takes under consideration the numbers from Oct. The top number in Dec should be close to 3823 and the one in Jan 3745 and in Feb 3625. Is there anyway to stabilize the top figure in each month to show the difference from the original loss of customers (the second image) please? 4054 - 71 - 72 - 88 - 78 - 119 = Top Feb number should be 3626.

- Mark as New
- Bookmark
- Subscribe
- Mute
- Subscribe to RSS Feed
- Permalink
- Report Inappropriate Content
I am looking at the issue now. Can you also comment about the other rows? All other row numbers look good, except the top row?