Unlock a world of possibilities! Login now and discover the exclusive benefits awaiting you.
- Qlik Community
- :
- All Forums
- :
- QlikView App Dev
- :
- Re: Color the mean of a bar chart
- Subscribe to RSS Feed
- Mark Topic as New
- Mark Topic as Read
- Float this Topic for Current User
- Bookmark
- Subscribe
- Mute
- Printer Friendly Page
- Mark as New
- Bookmark
- Subscribe
- Mute
- Subscribe to RSS Feed
- Permalink
- Report Inappropriate Content
Color the mean of a bar chart
I'm attempting to color the mean value SUM/Count in a bar chart. I know this is accomplished by the background color of the expression.
Currently I have variables stored as:
eInitialPainScore = SUM({$<InitialIND = {'1'}>}Triggers)
eInitialMean = SUM({$<InitialIND = {'1'}>}Triggers)/COUNT({$<InitialIND = {'1'}>}DISTINCT(PainScore))
The values of PainScore is between 0-10 and the InitialIND is set as 0 or 1.
The expression in my chart is calling $(eInitialPainScore)
I set the background color expression as IF($(eInitialPainScore) = ($(eInitialMean)), Black())
What this does is color every bar in the chart black. If I change it to IF($(eInitialPainScore) = 24, Black()) This will only color the number 24 on the chart. Any idea as to what i'm doing incorrectly?
Accepted Solutions
- Mark as New
- Bookmark
- Subscribe
- Mute
- Subscribe to RSS Feed
- Permalink
- Report Inappropriate Content
I believe the problem is you are calculating mean at the dimension level. Which means Score will always equal Mean. What I understand you want to do is calculate the mean for the entire set, which would be:
SUM({$<InitialIND = {'1'}>}TOTAL Triggers)/COUNT({$<InitialIND = {'1'}>}TOTAL DISTINCT(PainScore))
The TOTAL Qualifier causes the dimension to be ignored.
Since you appear to be calculating this in a variable, you could also calculate this once as a total mean by adding an "=" within the variable definition and leaving off the TOTAL:
=SUM({$<InitialIND = {'1'}>}Triggers)/COUNT({$<InitialIND = {'1'}>}DISTINCT(PainScore))
Even with either of the above, I don't think you are going to get a bar colored because you will never get an exact match between the Dimensional Score and the overall mean. So I define eInitialMean as:
=median(aggr(SUM({$<InitialIND = {'1'}>}Triggers)/COUNT({$<InitialIND = {'1'}>}DISTINCT(PainScore)),yourDimension))
-Rob
- Mark as New
- Bookmark
- Subscribe
- Mute
- Subscribe to RSS Feed
- Permalink
- Report Inappropriate Content
If you put eInitialMean in a text box what value do you get. Do you get 24?
- Mark as New
- Bookmark
- Subscribe
- Mute
- Subscribe to RSS Feed
- Permalink
- Report Inappropriate Content
Hi Nick,
Try like this, for chart expression you have use [] not $,
=IF([eInitialPainScore] = eInitialMean, Black())
Hope this helps you.
Regards,
Jagan.
- Mark as New
- Bookmark
- Subscribe
- Mute
- Subscribe to RSS Feed
- Permalink
- Report Inappropriate Content
I believe the problem is you are calculating mean at the dimension level. Which means Score will always equal Mean. What I understand you want to do is calculate the mean for the entire set, which would be:
SUM({$<InitialIND = {'1'}>}TOTAL Triggers)/COUNT({$<InitialIND = {'1'}>}TOTAL DISTINCT(PainScore))
The TOTAL Qualifier causes the dimension to be ignored.
Since you appear to be calculating this in a variable, you could also calculate this once as a total mean by adding an "=" within the variable definition and leaving off the TOTAL:
=SUM({$<InitialIND = {'1'}>}Triggers)/COUNT({$<InitialIND = {'1'}>}DISTINCT(PainScore))
Even with either of the above, I don't think you are going to get a bar colored because you will never get an exact match between the Dimensional Score and the overall mean. So I define eInitialMean as:
=median(aggr(SUM({$<InitialIND = {'1'}>}Triggers)/COUNT({$<InitialIND = {'1'}>}DISTINCT(PainScore)),yourDimension))
-Rob
- Mark as New
- Bookmark
- Subscribe
- Mute
- Subscribe to RSS Feed
- Permalink
- Report Inappropriate Content
This helped me get to where I was going. Instead of the =median i used AVG, and I added ROUND to the expression for eInitialMean.
Also, inside of how I previously had the background color expression. I used the TOTAL as you suggested i.e. IF (PainScore=AVG({$<$(eInitialMean)={">=0"}>}TOTAL $(eInitialMean)),BLACK())
Thanks Rob
- Mark as New
- Bookmark
- Subscribe
- Mute
- Subscribe to RSS Feed
- Permalink
- Report Inappropriate Content
Hey Rob,
It was a pleasure to meet you at the conference. We had a moment at lunch to discuss dimensionality to prevent the work around of stacking pivot tables and creating custom text boxes. I'm not sure how else to get a hold of you so i'm trying the community site.
I've been playing with dimensionaltity and it doesn't seem possible to do what i'm trying to accomplish. I took some screen shots. Below is the overview of the finished application. This application uses an alternate state, which is what the BenchMark in the sets refers to.
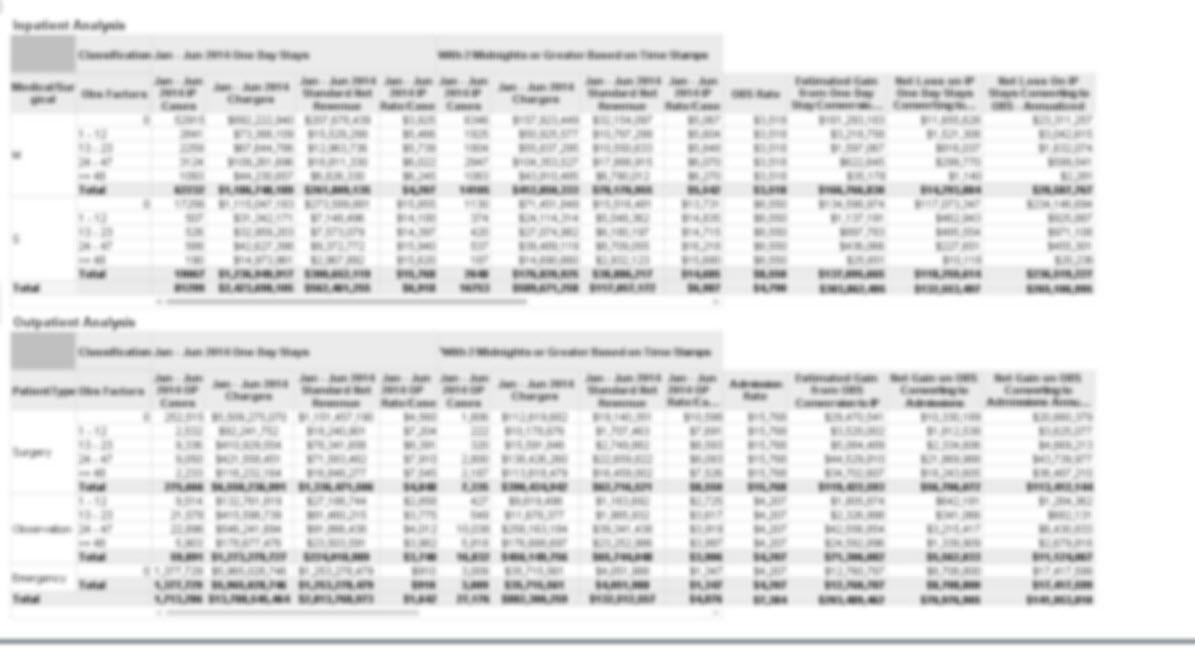
My pivot table utilizes the following pick statements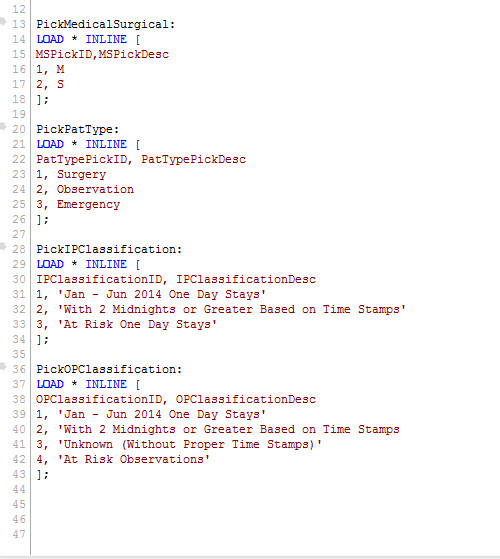
Next the three level dimensions are the following: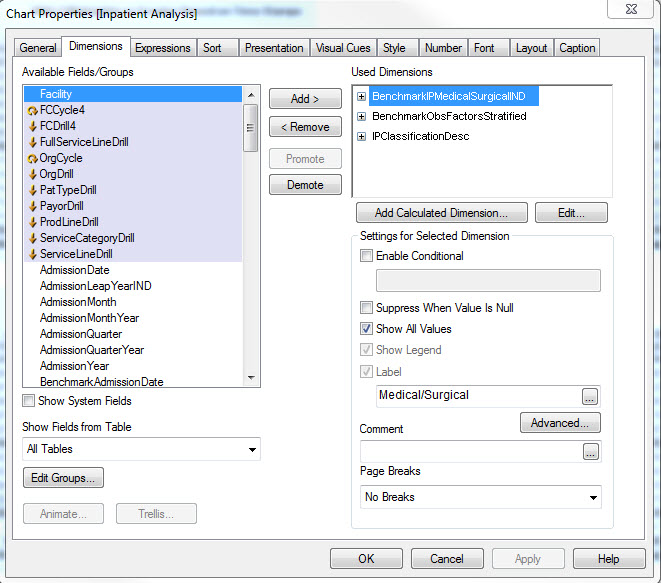
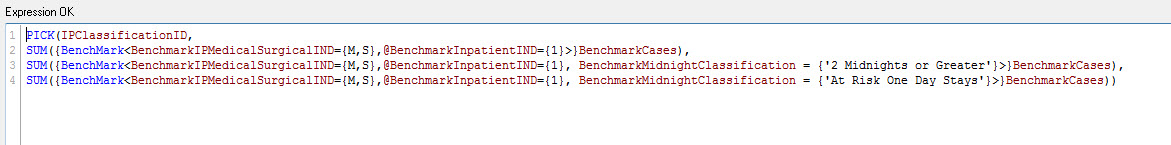
The metrics are all similar and uses a pick statement like the following:
Now the tricky part is the total columns, which in order to get it to work I had to create a second pivot table. With only two dimensions of IPMedicalSurgicalIND and ObsFactorsStratified, and to create the total columns I had to use the following 4 expressions.
PICK(MSPickID,
SUM({BenchMark<BenchmarkPatTypeHierarchy={'Observation','Emergency'},BenchmarkMidnightClassification = {'Two Midnights'}>}TOTAL BenchmarkHybridNetRevAmt)/SUM({BenchMark<BenchmarkPatTypeHierarchy={'Observation','Emergency'},BenchmarkMidnightClassification = {'Two Midnights'}>}TOTAL BenchmarkCases),
SUM({BenchMark<BenchmarkPatTypeHierarchy={'Surgery'},BenchmarkMidnightClassification = {'Two Midnights'}>}TOTAL BenchmarkHybridNetRevAmt)/SUM({BenchMark<BenchmarkPatTypeHierarchy={'Surgery'},BenchmarkMidnightClassification = {'Two Midnights'}>}TOTAL BenchmarkCases)
)
PICK(MSPickID,
SUM({BenchMark<BenchmarkMidnightClassification = {'At Risk One Day Stays'}, BenchmarkIPMedicalSurgicalIND = {'M'}>}BenchmarkCases) * [OBS Rate],
SUM({BenchMark<BenchmarkMidnightClassification = {'At Risk One Day Stays'}, BenchmarkIPMedicalSurgicalIND = {'S'}>}BenchmarkCases) * [OBS Rate])
PICK(MSPickID,
SUM({BenchMark<BenchmarkMidnightClassification = {'At Risk One Day Stays'}, BenchmarkIPMedicalSurgicalIND = {'M'}>}BenchmarkHybridNetRevAmt) - [Estimated Gain from One Day Stay Conversion to OP],
SUM({BenchMark<BenchmarkMidnightClassification = {'At Risk One Day Stays'}, BenchmarkIPMedicalSurgicalIND = {'S'}>}BenchmarkHybridNetRevAmt) - [Estimated Gain from One Day Stay Conversion to OP])
[Net Loss on IP One Day Stays Converting to OBS]*2
Since I used a PICK statement I can't get a grand total and had to create individual text boxes for the totals using the following:
=NUM($(eLossOneObs)
/
SUM({BenchMark<BenchmarkIPMedicalSurgicalIND={M,S},@BenchmarkInpatientIND={1}, BenchmarkMidnightClassification = {'At Risk One Day Stays'}>}BenchmarkCases),'$#,##0')
variable definition for eLossOneObs:
NUM(SUM({BenchMark<BenchmarkMidnightClassification = {'At Risk One Day Stays'}, BenchmarkIPMedicalSurgicalIND = {'M'}>}BenchmarkCases) * SUM({BenchMark<BenchmarkPatTypeHierarchy={'Observation','Emergency'},BenchmarkMidnightClassification = {'Two Midnights'}>}TOTAL BenchmarkHybridNetRevAmt)/SUM({BenchMark<BenchmarkPatTypeHierarchy={'Observation','Emergency'},BenchmarkMidnightClassification = {'Two Midnights'}>}TOTAL BenchmarkCases)
+
SUM({BenchMark<BenchmarkMidnightClassification = {'At Risk One Day Stays'}, BenchmarkIPMedicalSurgicalIND = {'S'}>}BenchmarkCases) * SUM({BenchMark<BenchmarkPatTypeHierarchy={'Surgery'},BenchmarkMidnightClassification = {'Two Midnights'}>}TOTAL BenchmarkHybridNetRevAmt)/SUM({BenchMark<BenchmarkPatTypeHierarchy={'Surgery'},BenchmarkMidnightClassification = {'Two Midnights'}>}TOTAL BenchmarkCases),'$#,##0')
Second total text box:
=NUM(SUM({BenchMark<BenchmarkMidnightClassification = {'At Risk One Day Stays'}, BenchmarkIPMedicalSurgicalIND = {'M'}>}BenchmarkCases) * SUM({BenchMark<BenchmarkPatTypeHierarchy={'Observation','Emergency'},BenchmarkMidnightClassification = {'Two Midnights'}>}TOTAL BenchmarkHybridNetRevAmt)/SUM({BenchMark<BenchmarkPatTypeHierarchy={'Observation','Emergency'},BenchmarkMidnightClassification = {'Two Midnights'}>}TOTAL BenchmarkCases)
+
SUM({BenchMark<BenchmarkMidnightClassification = {'At Risk One Day Stays'}, BenchmarkIPMedicalSurgicalIND = {'S'}>}BenchmarkCases) * SUM({BenchMark<BenchmarkPatTypeHierarchy={'Surgery'},BenchmarkMidnightClassification = {'Two Midnights'}>}TOTAL BenchmarkHybridNetRevAmt)/SUM({BenchMark<BenchmarkPatTypeHierarchy={'Surgery'},BenchmarkMidnightClassification = {'Two Midnights'}>}TOTAL BenchmarkCases),'$#,##0')
Third total text box:
=NUM(SUM({BenchMark<BenchmarkIPMedicalSurgicalIND={M,S},@BenchmarkInpatientIND={1},BenchmarkMidnightClassification = {'At Risk One Day Stays'}>} BenchmarkHybridNetRevAmt)-$(eLossOneObs),'$#,##0')
Forth total text box:
=NUM(SUM({BenchMark<BenchmarkIPMedicalSurgicalIND={M,S},@BenchmarkInpatientIND={1},BenchmarkMidnightClassification = {'At Risk One Day Stays'}>} BenchmarkHybridNetRevAmt * 2)-$(eLossOneObs) *2,'$#,##0')