Unlock a world of possibilities! Login now and discover the exclusive benefits awaiting you.
- Qlik Community
- :
- All Forums
- :
- QlikView App Dev
- :
- Re: Combined Graph - 2 Dimensions and 2 Metrics
- Subscribe to RSS Feed
- Mark Topic as New
- Mark Topic as Read
- Float this Topic for Current User
- Bookmark
- Subscribe
- Mute
- Printer Friendly Page
- Mark as New
- Bookmark
- Subscribe
- Mute
- Subscribe to RSS Feed
- Permalink
- Report Inappropriate Content
Combined Graph - 2 Dimensions and 2 Metrics
Hello everyone,
I'm trying to make a combined graphic in QV,
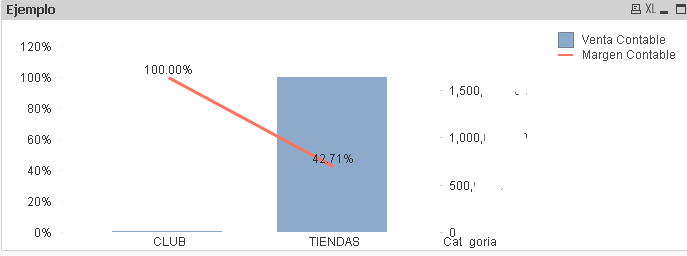
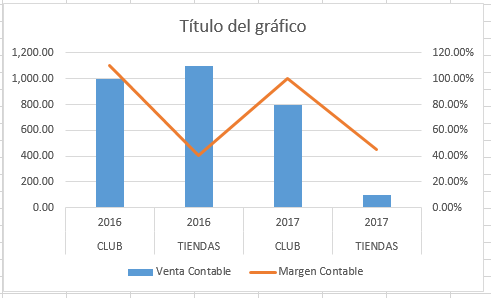
My idea is to have 2 dimensions: year and category and 2 metrics: the sale (primary axis, bar, in pesos) and the sales margin (secondary axis, line, percentage). This to be able to compare the annual sale and margin of the categories (Years and categories are selected)
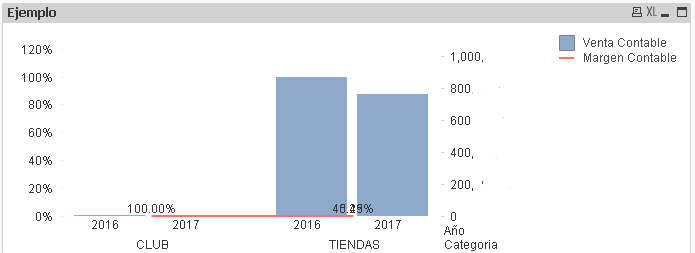
All good in my graphic when I have a single dimension, I correctly graph the sale and the margin, but when I add the second dimension, something strange happens, even though my secondary axis scale (Sales margin) goes from 0 to 100% The line graph appears badly graphed and very close to the x axis, although the percentages are 50 or 80%.
Example:
Graph with one dimension (category):
Graph when adding the second dimension (year):
What I need:
Does anyone know why this could be happening and how could it be solved?
I would greatly appreciate someone to help me.
Thank you!
- Tags:
- combine graphs
- Mark as New
- Bookmark
- Subscribe
- Mute
- Subscribe to RSS Feed
- Permalink
- Report Inappropriate Content
You have put in category dimension first and then the year as the second dimension.
You will have to put in year first and then the category.... or just reorder them by moving year up by selecting year and pressing the promote button in the dimension tab.
- Mark as New
- Bookmark
- Subscribe
- Mute
- Subscribe to RSS Feed
- Permalink
- Report Inappropriate Content
Thank you Peter, I tried but it doesn't work yet
- Mark as New
- Bookmark
- Subscribe
- Mute
- Subscribe to RSS Feed
- Permalink
- Report Inappropriate Content
If you could make a small sample app it would be very helpful for us to find a solution for you.
- Mark as New
- Bookmark
- Subscribe
- Mute
- Subscribe to RSS Feed
- Permalink
- Report Inappropriate Content
Hello Petter,
Here is my small sample.
I really appreciate your support.