Unlock a world of possibilities! Login now and discover the exclusive benefits awaiting you.
- Qlik Community
- :
- All Forums
- :
- QlikView App Dev
- :
- Re: Combo Chart: Stacked Bar Two Dimension >1 Expr...
- Subscribe to RSS Feed
- Mark Topic as New
- Mark Topic as Read
- Float this Topic for Current User
- Bookmark
- Subscribe
- Mute
- Printer Friendly Page
- Mark as New
- Bookmark
- Subscribe
- Mute
- Subscribe to RSS Feed
- Permalink
- Report Inappropriate Content
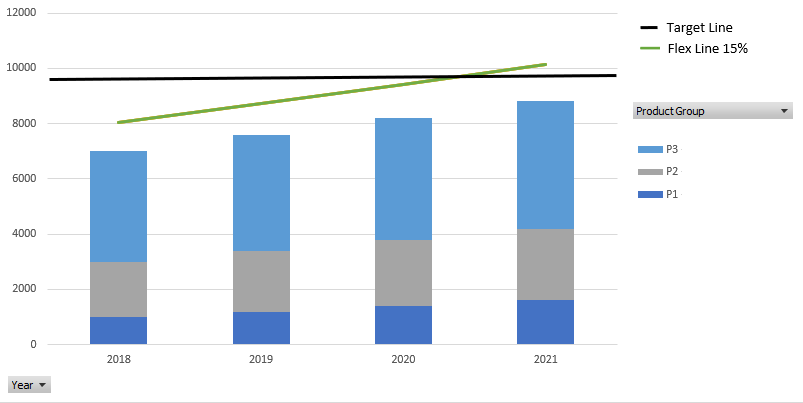
Combo Chart: Stacked Bar Two Dimension >1 Expression
Hi Friends,
following problem:
I have a Combo Chart with two Dimensions.
1. Year
2. Product Group
In the Chart I want to show:
1. Expression: per Year the sum of Amount per Product Group in stacked bar (sum(amount)
2. Expression: first Expression * 115% in Lines (sum(amount) * 1,15)
3. Expression: a fixed target value in Lines (This can possibly solved with a reference line in presentation)
QlikView makes automatically o grouped bar if I have a second expression.
There are over 100 product groups available, so I can't do it with set analysis for every product group.
thanks for your tips
- Mark as New
- Bookmark
- Subscribe
- Mute
- Subscribe to RSS Feed
- Permalink
- Report Inappropriate Content
How is looking now?
- Mark as New
- Bookmark
- Subscribe
- Mute
- Subscribe to RSS Feed
- Permalink
- Report Inappropriate Content
Hi Anil,
like this: This is only an Example with only 3 Product Groups.
- Mark as New
- Bookmark
- Subscribe
- Mute
- Subscribe to RSS Feed
- Permalink
- Report Inappropriate Content
Anil, any idea?
- Mark as New
- Bookmark
- Subscribe
- Mute
- Subscribe to RSS Feed
- Permalink
- Report Inappropriate Content
I may have idea or at least work around will work. But, Really mockup needed