Unlock a world of possibilities! Login now and discover the exclusive benefits awaiting you.
- Qlik Community
- :
- All Forums
- :
- QlikView App Dev
- :
- Re: Combo chart - How to set Line Color different ...
- Subscribe to RSS Feed
- Mark Topic as New
- Mark Topic as Read
- Float this Topic for Current User
- Bookmark
- Subscribe
- Mute
- Printer Friendly Page
- Mark as New
- Bookmark
- Subscribe
- Mute
- Subscribe to RSS Feed
- Permalink
- Report Inappropriate Content
Combo chart - How to set Line Color different than Bars ?
Hi all,
I am new to qlikview.
i have a combo chart in which i am displaying Line along with Bar.
I want to set Line color in Blue and Bar color in Red.
But, currently, Bar and Line both shows in Red color.
how can we set Line color different than Bar in Combo chart ?
I have check all option, but did not found anything.
- Tags:
- new_to_qlikview
- Mark as New
- Bookmark
- Subscribe
- Mute
- Subscribe to RSS Feed
- Permalink
- Report Inappropriate Content
Go to the Expressions tab. Click the plus symbol next to the equation for your line. Double click Background Color and assign it a value.
You can do things like this:
Set it to named color: Blue()
Or set it to specific color: rgb(0,0,255)
- Mark as New
- Bookmark
- Subscribe
- Mute
- Subscribe to RSS Feed
- Permalink
- Report Inappropriate Content
there are a couple of ways to do this. one is to adjust the Colors 1-6 in Colors tab in the same order as your expressions for the bars and lines.
second way is this: click on the plus sign to the left of each expression (Expressions tab), select background color and in the definition for background color, type in the color you need. colors can be input in multiple ways, simplest is by the name itself - blue(), red(), etc. you can also use rgb or argb functions to get the exact color you need.
- Mark as New
- Bookmark
- Subscribe
- Mute
- Subscribe to RSS Feed
- Permalink
- Report Inappropriate Content
I have followed this steps.
this way, both line and bar shows in same color.
i want to show line and bar in different color.
- Mark as New
- Bookmark
- Subscribe
- Mute
- Subscribe to RSS Feed
- Permalink
- Report Inappropriate Content
Hi Hailey
Can you post an example?
- Mark as New
- Bookmark
- Subscribe
- Mute
- Subscribe to RSS Feed
- Permalink
- Report Inappropriate Content
the only way i can imagine this happening is if you have one expression and selected bar and line in Display Options. is that right? if yes, then create another expression with the same formula and then you should be able to get different colors. if not, may be a sample example file or screenshots of your expressions tab and chart will help resolve this.
- Mark as New
- Bookmark
- Subscribe
- Mute
- Subscribe to RSS Feed
- Permalink
- Report Inappropriate Content
You probably have something like this set up:
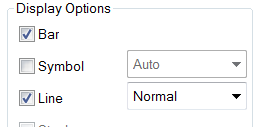
Deselect one of those options, create a new expression with the exact same formula for the other option and follow the above steps. Is this correct?