Unlock a world of possibilities! Login now and discover the exclusive benefits awaiting you.
- Qlik Community
- :
- All Forums
- :
- QlikView App Dev
- :
- Re: Combo chart position values on point
- Subscribe to RSS Feed
- Mark Topic as New
- Mark Topic as Read
- Float this Topic for Current User
- Bookmark
- Subscribe
- Mute
- Printer Friendly Page
- Mark as New
- Bookmark
- Subscribe
- Mute
- Subscribe to RSS Feed
- Permalink
- Report Inappropriate Content
Combo chart position values on point
I have a ComboChart with two expressions: bars and a line. I would like to display values for both, but the values are overlapping and all in same font.
Would it be possible to
* specify the position / inclination of value on points ?
* specify the font of values on point ?
Regards
- Mark as New
- Bookmark
- Subscribe
- Mute
- Subscribe to RSS Feed
- Permalink
- Report Inappropriate Content
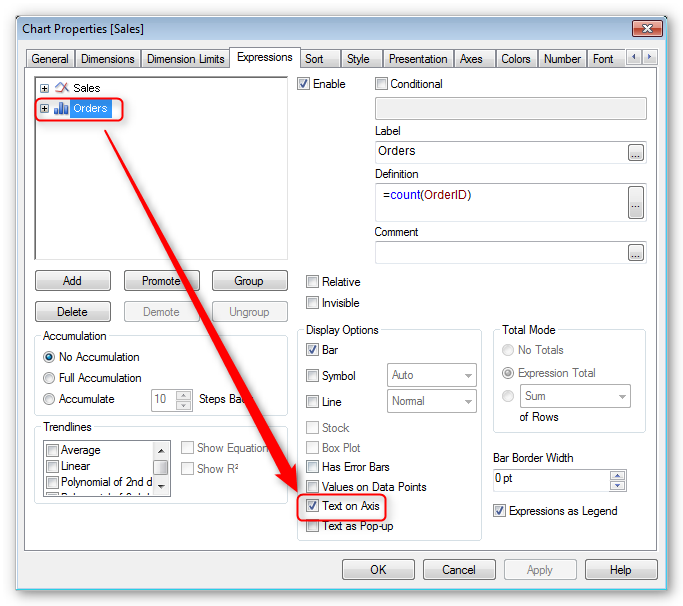
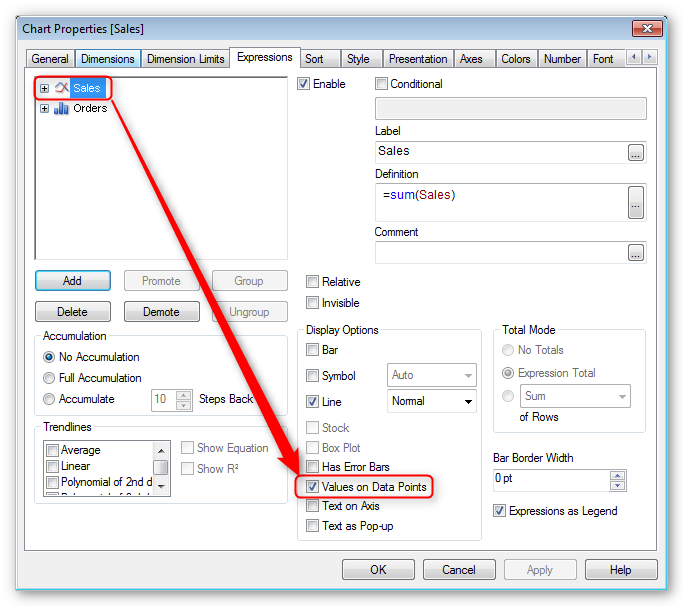
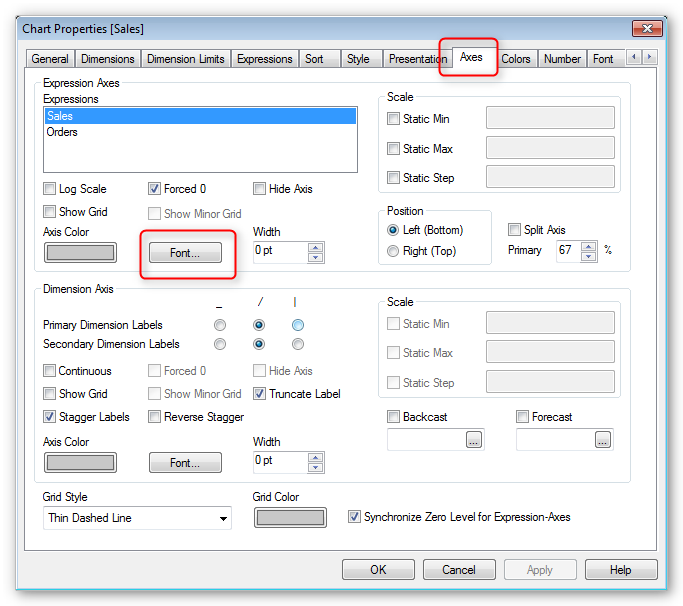
One workaround would be to put the text on the axis for the bar chart element and the values on data points for the line chart, or vice versa. The font can be changed in the Axes tab.
Font:
- Mark as New
- Bookmark
- Subscribe
- Mute
- Subscribe to RSS Feed
- Permalink
- Report Inappropriate Content
Font is for the font of the axis labels, not the point values.
How can I set this font.
Besides, how to show the name of the Y axes ?
Thanks
- Mark as New
- Bookmark
- Subscribe
- Mute
- Subscribe to RSS Feed
- Permalink
- Report Inappropriate Content
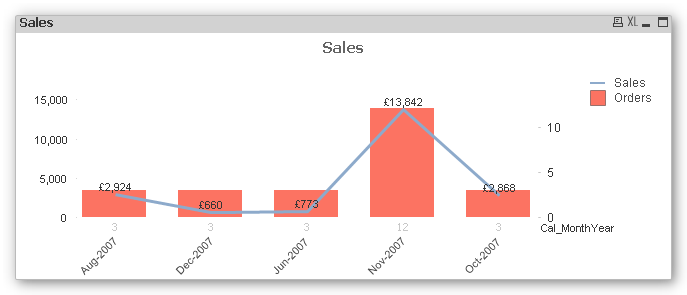
I just tested it and it changed the size of the font on the data points too
- Mark as New
- Bookmark
- Subscribe
- Mute
- Subscribe to RSS Feed
- Permalink
- Report Inappropriate Content
Font size 12
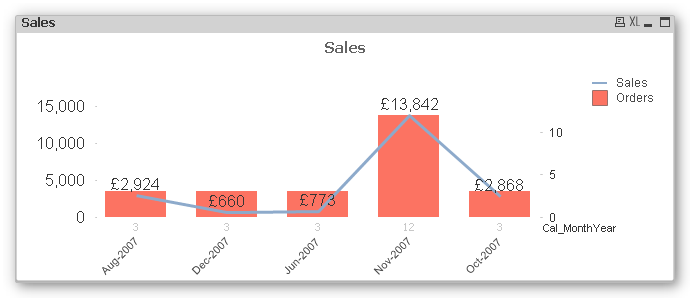
Font size 8
- Mark as New
- Bookmark
- Subscribe
- Mute
- Subscribe to RSS Feed
- Permalink
- Report Inappropriate Content
oilandgas wrote:
Besides, how to show the name of the Y axes ?
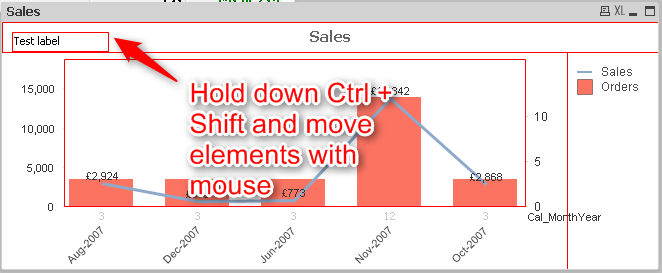
Add Text in Chart:
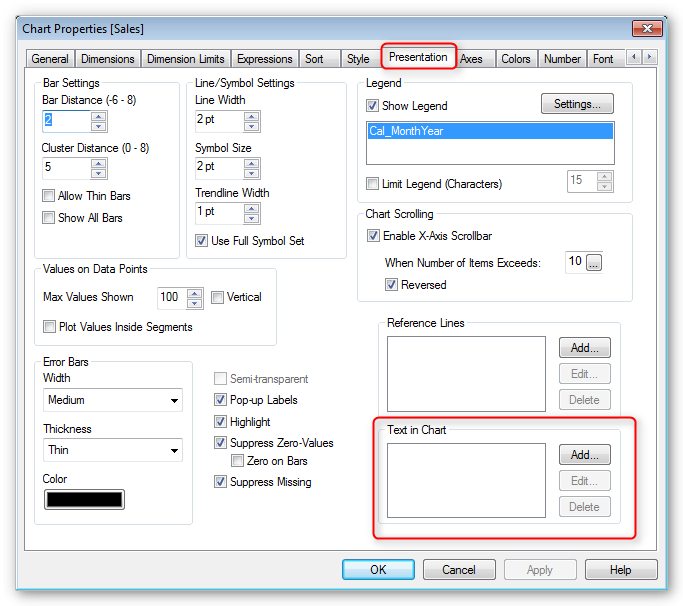
And move the text to where you want it while holding down Ctrl + Shift:
