Unlock a world of possibilities! Login now and discover the exclusive benefits awaiting you.
- Qlik Community
- :
- All Forums
- :
- QlikView App Dev
- :
- Re: Comparing accounts in different time periods
- Subscribe to RSS Feed
- Mark Topic as New
- Mark Topic as Read
- Float this Topic for Current User
- Bookmark
- Subscribe
- Mute
- Printer Friendly Page
- Mark as New
- Bookmark
- Subscribe
- Mute
- Subscribe to RSS Feed
- Permalink
- Report Inappropriate Content
Comparing accounts in different time periods
I have a dataset which shows me transactions and the accounts associated with them:
| Account_ID | Transaction_Date | Revenue | Clean_date |
|---|---|---|---|
| 123 | 05-01-2017 | 100.50 | 2017/01 |
| 234 | 24-01-2017 | 50.21 | 2017/01 |
| 123 | 21-01-2018 | 253.19 | 2018/01 |
| 456 | 29-01-2018 | 432.65 | 2018/01 |
| 234 | 07-01-2018 | 324.94 | 2018/01 |
| 666 | 09-02-2017 | 234.08 | 2017/02 |
| 666 | 28-02-2018 | 378.94 | 2018/02 |
| 654 | 23-02-2017 | 342.87 | 2017/02 |
| 785 | 17-01-2018 | 324 | 2018/01 |
I would like to be able to show how many of the accounts spent in the selected month compared to the same month in the previous year. For example, if I select 2018/01 I would like to see if the account had revenue in 2017/01 (account 123 would meet this criteria).
I originally solved this within SQL, however my data is down to transaction level now and I am stuck on how to write an expression to provide me with the information, I want to show this at an aggregate level (1 account in total) and also a breakdown of the accounts.
Accepted Solutions
- Mark as New
- Bookmark
- Subscribe
- Mute
- Subscribe to RSS Feed
- Permalink
- Report Inappropriate Content
EDITED !
So try this (I changed a little bit the expression)
sum({<Clean_date={">=$(=Date(Monthstart(AddMonths(Date(Date#(Clean_date,'YYYY/MM'),'YYYY/MM'),-12)),'YYYY/MM'))<=$(=Date(MonthEnd(AddMonths(Date(Date#(Clean_date,'YYYY/MM'),'YYYY/MM'),-12)),'YYYY/MM'))"}>} Revenue)
Here we can remove the Monthstart() and Monthend functions because it is YYYYMM field, we just need to put = sign to have all the month included on our set analysis.
- Mark as New
- Bookmark
- Subscribe
- Mute
- Subscribe to RSS Feed
- Permalink
- Report Inappropriate Content
Hi,
what do you mean by "show how many of the accounts spent" ?
if we take the Account ID 123 for example, what do you expect as an output ?
- Mark as New
- Bookmark
- Subscribe
- Mute
- Subscribe to RSS Feed
- Permalink
- Report Inappropriate Content
I mean, how many accounts spent in both the selected month and the same month in the previous year.
Account 123 would be counted as 1, as I have selected 2018/01 and they have revenue within 2018/01 AND 2017/01.
- Mark as New
- Bookmark
- Subscribe
- Mute
- Subscribe to RSS Feed
- Permalink
- Report Inappropriate Content
if you combine this with some IF
sum({<Transaction_Date={">=$(=Monthstart(AddMonths(Transaction_Date,-12)))<=$(=MonthEnd(AddMonths(Transaction_Date,-12)))"}>} Revenue)
you should be able to see the expected output.
in the attached app, as soon as you select Account 123 and date = 21/01/2018, the table in the middle will show you the revenue of that account on the last year on the same month, if there is no data on the last year same month related with your selection, nothing will appear.
test it and let me know
- Mark as New
- Bookmark
- Subscribe
- Mute
- Subscribe to RSS Feed
- Permalink
- Report Inappropriate Content
Thanks for the example, I had a play with it but it doesn't do what I need it to do unfortunately.
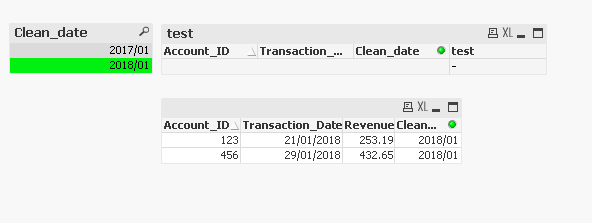
In my app I would like to select the below (2018/01) as an example, if you see in the bottom table account 123 appears and so does 456 as they have a transaction within that month, however, I would like a table just showing account 123 as they have transactions in 2018/01 AND 2017/01.
- Mark as New
- Bookmark
- Subscribe
- Mute
- Subscribe to RSS Feed
- Permalink
- Report Inappropriate Content
EDITED !
So try this (I changed a little bit the expression)
sum({<Clean_date={">=$(=Date(Monthstart(AddMonths(Date(Date#(Clean_date,'YYYY/MM'),'YYYY/MM'),-12)),'YYYY/MM'))<=$(=Date(MonthEnd(AddMonths(Date(Date#(Clean_date,'YYYY/MM'),'YYYY/MM'),-12)),'YYYY/MM'))"}>} Revenue)
Here we can remove the Monthstart() and Monthend functions because it is YYYYMM field, we just need to put = sign to have all the month included on our set analysis.
- Mark as New
- Bookmark
- Subscribe
- Mute
- Subscribe to RSS Feed
- Permalink
- Report Inappropriate Content
Ah I see, okay this works a lot better. How do I show the accounts without having to select the account number? The end user wants to see accounts with transactions in both years, if I select the date, it should automatically show all accounts that meet the criteria. Thank you.
- Mark as New
- Bookmark
- Subscribe
- Mute
- Subscribe to RSS Feed
- Permalink
- Report Inappropriate Content
EDITED
Try this on the expression part:
Only({$<Account_ID = P({1<Clean_date={"$(=Date(AddMonths(Date(Date#(Clean_date,'YYYY/MM'),'YYYY/MM'),-12),'YYYY/MM'))"}>} Account_ID)>} Account_ID )
here is the new expression:
just remove the 1 after the P function
Only({$<Account_ID = P({<Clean_date={"$(=Date(AddMonths(Date(Date#(Clean_date,'YYYY/MM'),'YYYY/MM'),-12),'YYYY/MM'))"}>} Account_ID)>} Account_ID )
- Mark as New
- Bookmark
- Subscribe
- Mute
- Subscribe to RSS Feed
- Permalink
- Report Inappropriate Content
This works perfectly, is this called Set Analysis? I will read up. Many thanks, I understand a lot better now.
- Mark as New
- Bookmark
- Subscribe
- Mute
- Subscribe to RSS Feed
- Permalink
- Report Inappropriate Content
Yes this is called set analysis, and here it is a nested set analysis using P() function. It is advanced level, so try to be comfortable with simple set analysis syntax before