Unlock a world of possibilities! Login now and discover the exclusive benefits awaiting you.
- Qlik Community
- :
- All Forums
- :
- QlikView App Dev
- :
- Re: Comparing two different year ?
- Subscribe to RSS Feed
- Mark Topic as New
- Mark Topic as Read
- Float this Topic for Current User
- Bookmark
- Subscribe
- Mute
- Printer Friendly Page
- Mark as New
- Bookmark
- Subscribe
- Mute
- Subscribe to RSS Feed
- Permalink
- Report Inappropriate Content
Comparing two different year ?
need to compare two different years ( 2011 and 2010) using variables.
Can any one help.
tnx
- Tags:
- new_to_qlikview
- Mark as New
- Bookmark
- Subscribe
- Mute
- Subscribe to RSS Feed
- Permalink
- Report Inappropriate Content
I have used :
SUM({<Year = {'$(=Max(Year)-3)'}>}Sales) //2011
SUM({<Year = {'$(=Max(Year)-4)'}>}Sales) // 2014
The problem is that, i can not see both lines graphs at the same time for comparison.
- Mark as New
- Bookmark
- Subscribe
- Mute
- Subscribe to RSS Feed
- Permalink
- Report Inappropriate Content
Keep Month as Dimension
- Mark as New
- Bookmark
- Subscribe
- Mute
- Subscribe to RSS Feed
- Permalink
- Report Inappropriate Content
You are right for the st expression.
but why can not i see comparison graph like this : (I can not see it )
http://community.qlik.com/blogs/qlikviewdesignblog/2014/03/03/ytd
- Mark as New
- Bookmark
- Subscribe
- Mute
- Subscribe to RSS Feed
- Permalink
- Report Inappropriate Content
Exactly you not get it depends on the value in the fields in your model like month and Year values. Also after creating line chart format the line chart like click on the expression >> Display options >> Select Smooth from the options.
- Mark as New
- Bookmark
- Subscribe
- Mute
- Subscribe to RSS Feed
- Permalink
- Report Inappropriate Content
You need to take Monthyear Inpace of month then it will look like graph
Create monthYear field
MonthName(Date) as MonthYear and take as dimension
use same expressions as provided above posts
hope this helps
- Mark as New
- Bookmark
- Subscribe
- Mute
- Subscribe to RSS Feed
- Permalink
- Report Inappropriate Content
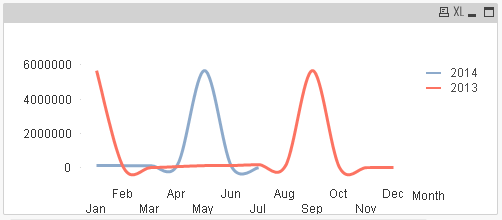
After taking line chart and adding Dimension and Expression
Dimension:-Month
Previous Year
Sum({<Year = {'$(=Max(Year)-1)'}>}Sales)
And
Current Year
Sum({<Year = {'$(=Max(Year))'}>}Sales)
See the snap shot of the Line chart with the Month Dimension and Expression for current and previous
- Mark as New
- Bookmark
- Subscribe
- Mute
- Subscribe to RSS Feed
- Permalink
- Report Inappropriate Content
No need to take two expression
simply Take month and year in dimension
and expression
sum({<Year={'2010','2011'}>} Amount)
hope this helps
- Mark as New
- Bookmark
- Subscribe
- Mute
- Subscribe to RSS Feed
- Permalink
- Report Inappropriate Content
even expression
sum({<Year={'2010','2011'}>} Amount)
can be dynamic
like below
sum({<Year={">=$(=Max(Year))"}>}Amount)
this helps you to compare current Year Vs previous Year
hope this helps
- Mark as New
- Bookmark
- Subscribe
- Mute
- Subscribe to RSS Feed
- Permalink
- Report Inappropriate Content
Thanks a lot.
It worked very well
- Mark as New
- Bookmark
- Subscribe
- Mute
- Subscribe to RSS Feed
- Permalink
- Report Inappropriate Content
The same answer I have given long time ago !!