Unlock a world of possibilities! Login now and discover the exclusive benefits awaiting you.
- Qlik Community
- :
- All Forums
- :
- QlikView App Dev
- :
- Comulative Values
- Subscribe to RSS Feed
- Mark Topic as New
- Mark Topic as Read
- Float this Topic for Current User
- Bookmark
- Subscribe
- Mute
- Printer Friendly Page
- Mark as New
- Bookmark
- Subscribe
- Mute
- Subscribe to RSS Feed
- Permalink
- Report Inappropriate Content
Comulative Values
HI All , I
I m calculating values over Id and month , it is giving me correct result but i make any selection in month the same values are not coming same .
For example in my attached file, first dont select any month and see the value for every ID wise (For Jan )and select Jan month and Check the value ,
Not showing the same values.
Can any one tell me how to get this ?
Accepted Solutions
- Mark as New
- Bookmark
- Subscribe
- Mute
- Subscribe to RSS Feed
- Permalink
- Report Inappropriate Content
Try this:
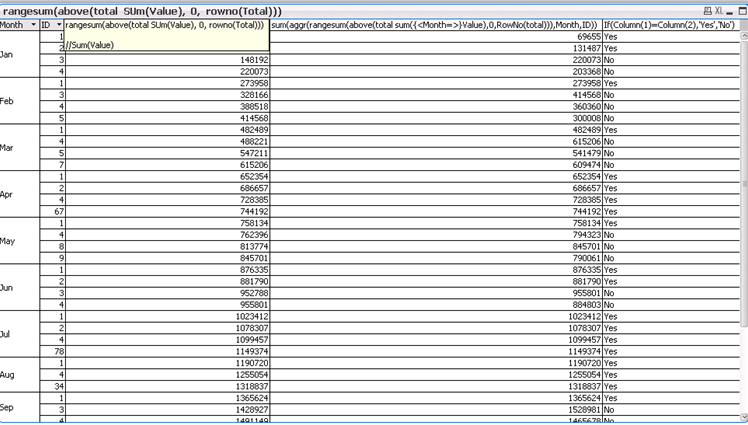
RangeSum(Above(TOTAL Sum({<Month>}Value), 0, RowNo(TOTAL))) * Avg(1)
- Mark as New
- Bookmark
- Subscribe
- Mute
- Subscribe to RSS Feed
- Permalink
- Report Inappropriate Content
Try this one: sum(aggr(rangesum(above(total sum({<Month=>}Value),0,RowNo(total))),Month,ID))
talk is cheap, supply exceeds demand
- Mark as New
- Bookmark
- Subscribe
- Mute
- Subscribe to RSS Feed
- Permalink
- Report Inappropriate Content
Hi ,
Thank you so much for ur responce,
In this expression , its giving me correct as per the data, But If the ID are not same for every month, then in that case its not giving me correct values.
- Mark as New
- Bookmark
- Subscribe
- Mute
- Subscribe to RSS Feed
- Permalink
- Report Inappropriate Content
Try this:
RangeSum(Above(TOTAL Sum({<Month>}Value), 0, RowNo(TOTAL))) * Avg(1)
- Mark as New
- Bookmark
- Subscribe
- Mute
- Subscribe to RSS Feed
- Permalink
- Report Inappropriate Content
HI Sunny,
Its working fine.
Can u explain me , why we used here * avg (1)
- Mark as New
- Bookmark
- Subscribe
- Mute
- Subscribe to RSS Feed
- Permalink
- Report Inappropriate Content
Check out my explanation about Avg(1) here:
Re: Chart Funcationality: How can I ignore evaluation of second dimension (for an expression)?