Unlock a world of possibilities! Login now and discover the exclusive benefits awaiting you.
- Qlik Community
- :
- All Forums
- :
- QlikView App Dev
- :
- Condional formatting - with calculated dimension
- Subscribe to RSS Feed
- Mark Topic as New
- Mark Topic as Read
- Float this Topic for Current User
- Bookmark
- Subscribe
- Mute
- Printer Friendly Page
- Mark as New
- Bookmark
- Subscribe
- Mute
- Subscribe to RSS Feed
- Permalink
- Report Inappropriate Content
Condional formatting - with calculated dimension
Hi ,
I have a calculated dimension to calculate the age buckets for claims with respect to toddy's date in a block chart.
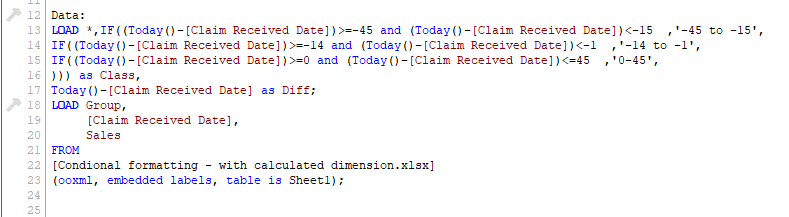
Calculated Dimension :
=IF((Today()-[Claim Received Date])>=-45 and (Today()-[Claim Received Date])<-15 ,'-45 to -15',
IF((Today()-[Claim Received Date])>=-14 and (Today()-[Claim Received Date])<-1 ,'-14 to -1',
IF((Today()-[Claim Received Date])>=0 and (Today()-[Claim Received Date])<=45 ,'0-45',
)))
Expression :
Count(Claim Number)
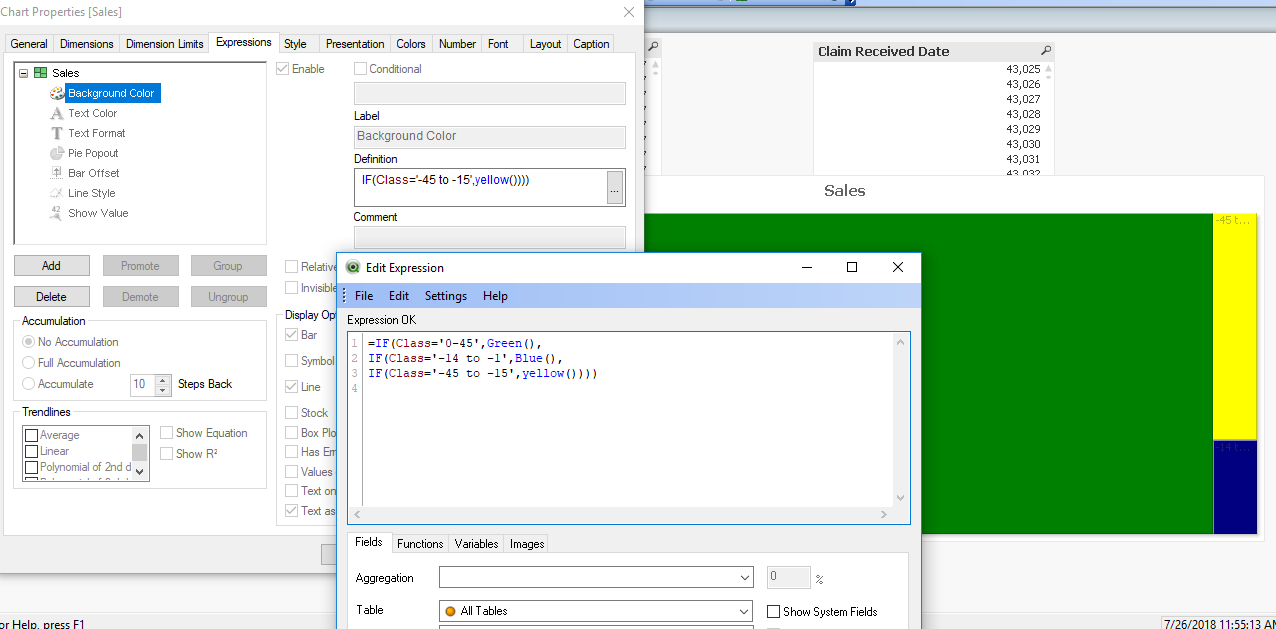
I have requirement of coloring the block chart with the below colors for each range.
0-45 | Green |
-14 to -1 | Blue |
-45 to -15 | yellow |
How can I achieve this requirement.?
I tried putting a background expression in the expression and its not working. What is the right way of doing it ?
Appreciate your help on this.
Thanks
NV
- « Previous Replies
-
- 1
- 2
- Next Replies »
- Mark as New
- Bookmark
- Subscribe
- Mute
- Subscribe to RSS Feed
- Permalink
- Report Inappropriate Content
Hi,
Please try like this.
- Mark as New
- Bookmark
- Subscribe
- Mute
- Subscribe to RSS Feed
- Permalink
- Report Inappropriate Content
Why can't you use same for BG color of that calculated dimension.
=IF((Today()-[Claim Received Date])>=-45 and (Today()-[Claim Received Date])<-15 ,Yellow(),
IF((Today()-[Claim Received Date])>=-14 and (Today()-[Claim Received Date])<-1 ,Blue(),
IF((Today()-[Claim Received Date])>=0 and (Today()-[Claim Received Date])<=45 ,Green(),
)))
- Mark as New
- Bookmark
- Subscribe
- Mute
- Subscribe to RSS Feed
- Permalink
- Report Inappropriate Content
You're already using: Calculated Dimension,
and Expression is: Count([Claim Number]),
Then in expression, for the Background:
Use the below expression, to format colors:
=IF(Count([Claim Number])>=0 and Count([Claim Number])<=45,Green(),
IF(Count([Claim Number])>=-14 and Count([Claim Number])<=-1,Blue(),
IF(Count([Claim Number])>=-45 and Count([Claim Number])<=-15,Yellow())))
- Mark as New
- Bookmark
- Subscribe
- Mute
- Subscribe to RSS Feed
- Permalink
- Report Inappropriate Content
Thanks for your response. This method is correct .
However, in my case, the dashboard refresh is on a weekly basis and user want to see this calculation dynamically with respect to the current date.
so moving the calculation to script level is not an option here. Any other thoughts please?
- Mark as New
- Bookmark
- Subscribe
- Mute
- Subscribe to RSS Feed
- Permalink
- Report Inappropriate Content
Thank for your response. I tried this and its not giving the expected result. all the values are highlighted in green color when i am using this.
- Mark as New
- Bookmark
- Subscribe
- Mute
- Subscribe to RSS Feed
- Permalink
- Report Inappropriate Content
Thank for your response. I tried this and its not giving the expected result. all the values are highlighted in green color when i am using this.
- Mark as New
- Bookmark
- Subscribe
- Mute
- Subscribe to RSS Feed
- Permalink
- Report Inappropriate Content
Can you attach sample XL data file?
- Mark as New
- Bookmark
- Subscribe
- Mute
- Subscribe to RSS Feed
- Permalink
- Report Inappropriate Content
Hi,
Please find the qvw file attached.
- Mark as New
- Bookmark
- Subscribe
- Mute
- Subscribe to RSS Feed
- Permalink
- Report Inappropriate Content
- « Previous Replies
-
- 1
- 2
- Next Replies »