Unlock a world of possibilities! Login now and discover the exclusive benefits awaiting you.
- Qlik Community
- :
- All Forums
- :
- QlikView App Dev
- :
- Condition to show a chart
- Subscribe to RSS Feed
- Mark Topic as New
- Mark Topic as Read
- Float this Topic for Current User
- Bookmark
- Subscribe
- Mute
- Printer Friendly Page
- Mark as New
- Bookmark
- Subscribe
- Mute
- Subscribe to RSS Feed
- Permalink
- Report Inappropriate Content
Condition to show a chart
Hello everyone,
How to Hide/Unhide Charts based on selections in a List box ?
I want that my chart be there if I pick something in the list box.
What would be the best way to do it ?
I have already tried in different ways : GetCurrentField / GetCurrentSelections / Count / GetFielsSelections but no results...
Thank you for you support,
Emmanuelle
Accepted Solutions
- Mark as New
- Bookmark
- Subscribe
- Mute
- Subscribe to RSS Feed
- Permalink
- Report Inappropriate Content
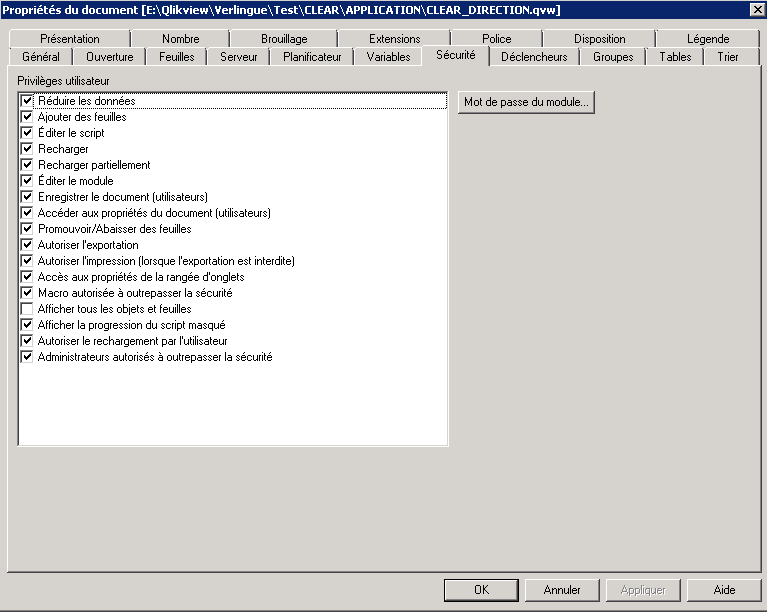
It was a properties in the document... "Afficher tous les objets et feuilles"
Thank you all of you

- Mark as New
- Bookmark
- Subscribe
- Mute
- Subscribe to RSS Feed
- Permalink
- Report Inappropriate Content
this?
=getselectedcount(field)>0
- Mark as New
- Bookmark
- Subscribe
- Mute
- Subscribe to RSS Feed
- Permalink
- Report Inappropriate Content
I would try using GetSelectedCount()
- Mark as New
- Bookmark
- Subscribe
- Mute
- Subscribe to RSS Feed
- Permalink
- Report Inappropriate Content
Hi,
PFA and select something in date u wil see text box..
Go there in text box n see the condition in layout tab.
I wrote something like: GetSelectedCount(date)>=1
Sachin
- Mark as New
- Bookmark
- Subscribe
- Mute
- Subscribe to RSS Feed
- Permalink
- Report Inappropriate Content
Similarly u do it in ur chart by replacing date by ur list box dimension..
Thanks
- Mark as New
- Bookmark
- Subscribe
- Mute
- Subscribe to RSS Feed
- Permalink
- Report Inappropriate Content
No working for all your solutions...
It's possible to have some properties in document QW who prevent the condition ?
- Mark as New
- Bookmark
- Subscribe
- Mute
- Subscribe to RSS Feed
- Permalink
- Report Inappropriate Content
Send application,if possible.
It should work..
Sachin
- Mark as New
- Bookmark
- Subscribe
- Mute
- Subscribe to RSS Feed
- Permalink
- Report Inappropriate Content
Where are you adding the condition?
The condition should be here
Chart Properties >
> Requires only one selection to view the chart
=GetSelectedCount(YourFieldname) = 1
> Can have One or many selections to view the chart
=GetSelectedCount(YourFieldname) <> 0
- Mark as New
- Bookmark
- Subscribe
- Mute
- Subscribe to RSS Feed
- Permalink
- Report Inappropriate Content
It was a properties in the document... "Afficher tous les objets et feuilles"
Thank you all of you
