Unlock a world of possibilities! Login now and discover the exclusive benefits awaiting you.
- Qlik Community
- :
- All Forums
- :
- QlikView App Dev
- :
- Convert Number into Date
- Subscribe to RSS Feed
- Mark Topic as New
- Mark Topic as Read
- Float this Topic for Current User
- Bookmark
- Subscribe
- Mute
- Printer Friendly Page
- Mark as New
- Bookmark
- Subscribe
- Mute
- Subscribe to RSS Feed
- Permalink
- Report Inappropriate Content
Convert Number into Date
Hi There
I have requirement like below.
Dimension: Month - I am getting number from 0 ,- 1, -2 , -3 ...-17. ( last 18 months of data).
In chart i am using this dimension and Expression for sum(Total).
I am seeing x axis dimensions as 0, -1,-2 .. -17. Instead of that i want to display last 18 months in MM YYYY format.
( 0 = Current month , -1= (Current month -1)
Thanks in advance.
- Tags:
- new_to_qlikview
- Mark as New
- Bookmark
- Subscribe
- Mute
- Subscribe to RSS Feed
- Permalink
- Report Inappropriate Content
You could try
Date(AddMonths(MonthStart(Today()),<YourMonthNumber>), 'MM YYYY')
HIC
- Mark as New
- Bookmark
- Subscribe
- Mute
- Subscribe to RSS Feed
- Permalink
- Report Inappropriate Content
Or also you can try with:
MonthName(AddMonths(MonthName(Today()),-N), 'MM YYYY')
where N = Index from 1 to 18
- Mark as New
- Bookmark
- Subscribe
- Mute
- Subscribe to RSS Feed
- Permalink
- Report Inappropriate Content
Thanks for the quick reply, but i dont want to display one month,
Entire 18 months data should be display.
- Mark as New
- Bookmark
- Subscribe
- Mute
- Subscribe to RSS Feed
- Permalink
- Report Inappropriate Content
If you use Henric's recommendation or Enrique's recommendation as a calculated dimension, you should be able to get all the dates in your chart. The difference is the Henric's solution will give you all the dates and Enrique's will give you data aggregated for each MonthYear.
You can also use their recommendation in the script to create the dimension in the script itself.
Hope this helps.
Best,
Sunny
- Mark as New
- Bookmark
- Subscribe
- Mute
- Subscribe to RSS Feed
- Permalink
- Report Inappropriate Content
Hi,
solutions could be also:
hope this helps
regards
Marco
- Mark as New
- Bookmark
- Subscribe
- Mute
- Subscribe to RSS Feed
- Permalink
- Report Inappropriate Content
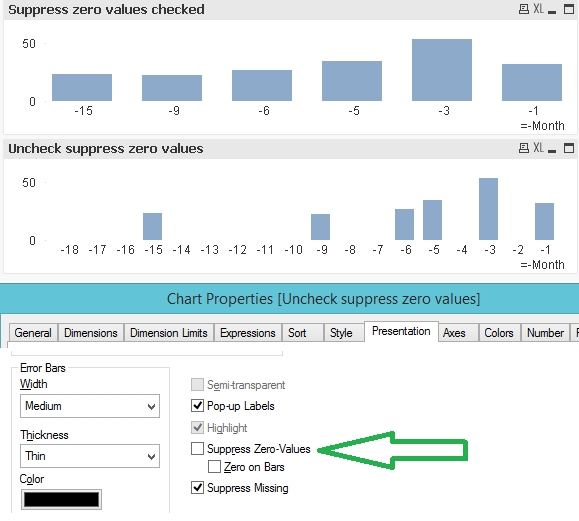
Thanks for the updates, I have IDNo as primary key and data associated with this ID.
e.g, For IDNo: 100100 , i am getting only 5 months of data , but in the graph i want to all previous 18 months.
hence , the for the month where data is not present it will show blank in graph.
- Mark as New
- Bookmark
- Subscribe
- Mute
- Subscribe to RSS Feed
- Permalink
- Report Inappropriate Content
Hello Ashish,
In a chart made from any of the examples provided, try unchecking 'Suppress Zero-Values'. This should show a bar plot for every dimension, even if there aren't any fact rows for a particular month (there must however at least be an entry for the dimension in the dimension table)
- Mark as New
- Bookmark
- Subscribe
- Mute
- Subscribe to RSS Feed
- Permalink
- Report Inappropriate Content