Unlock a world of possibilities! Login now and discover the exclusive benefits awaiting you.
- Qlik Community
- :
- All Forums
- :
- QlikView App Dev
- :
- Re: Count Products in Warranty Range
- Subscribe to RSS Feed
- Mark Topic as New
- Mark Topic as Read
- Float this Topic for Current User
- Bookmark
- Subscribe
- Mute
- Printer Friendly Page
- Mark as New
- Bookmark
- Subscribe
- Mute
- Subscribe to RSS Feed
- Permalink
- Report Inappropriate Content
Count Products in Warranty Range
Hey,
I have a Problem and couldn't solve it myself so far and have already searched here for a solution.
I would like to count the number of units which are still in their warranty period on a specific date.
As Dimension I have REPAIR_DATE. The later goal is to calculate the Costs per Units. repair costs on that date / units which are still in warranty on that date
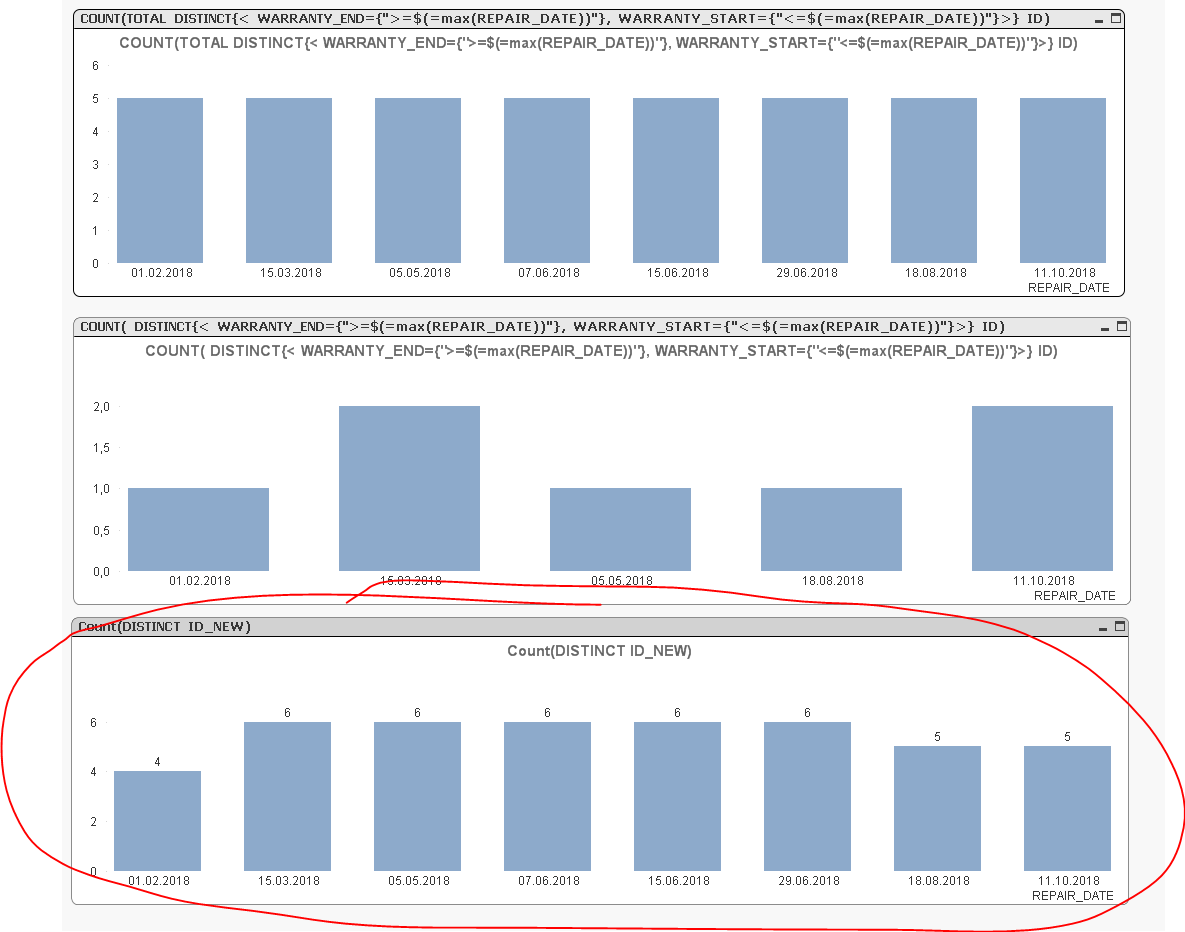
The Problem is that either I count all Products which are on the latest day in their warranty
COUNT(TOTAL DISTINCT{< WARRANTY_END={">=$(=max(REPAIR_DATE))"}, WARRANTY_START={"<=$(=max(REPAIR_DATE))"}>} REPAIR_ID)
or the number of products which are repaired on that day
COUNT( DISTINCT{< WARRANTY_END={">=$(=max(REPAIR_DATE))"}, WARRANTY_START={"<=$(=max(REPAIR_DATE))"}>} REPAIR_ID)
with the following table as example:
LOAD * INLINE [
ID, REPAIR_DATE, WARRANTY_START, WARRANTY_END, REPAIR_ID
1, 01.02.2018, 01.01.2018, 01.01.2019, 1
1, 15.03.2018, 01.01.2018, 01.01.2019, 2
2, 15.03.2018, 01.03.2018, 01.03.2019, 3
2, 05.05.2018, 01.03.2018, 01.03.2019, 4
3, 07.06.2018, 01.07.2017, 01.07.2018, 5
3, 15.06.2018, 01.07.2017, 01.07.2018, 6
3, 29.06.2018, 01.07.2017, 01.07.2018, 7
4, 18.08.2018, 01.01.2018, 01.01.2019, 8
5, 11.10.2018, 01.01.2018, 01.01.2019, 9
6, 11.10.2018, 01.03.2018, 01.03.2019, 10
];
e.g. for the 01.02.2018 the correct result would be 4. However I get 1(the repairs on that date) or 5 (the units in warranty on the 11.10.2018) .
I cannot aggregate beforehand on the loading script how many units are in warranty for each Date, because in the real data set there are more information e.g. product group, country etc. which would be lost.
I also attached a qvw as example with the formula used atm.
Thank you very much in advance!
Best,
Markus
- Mark as New
- Bookmark
- Subscribe
- Mute
- Subscribe to RSS Feed
- Permalink
- Report Inappropriate Content
May or may not work for you based on the size of your dashboard... but may be using Interval Match
Table:
LOAD * INLINE [
ID, REPAIR_DATE, WARRANTY_START, WARRANTY_END, REPAIR_ID
1, 01.02.2018, 01.01.2018, 01.01.2019, 1
1, 15.03.2018, 01.01.2018, 01.01.2019, 2
2, 15.03.2018, 01.03.2018, 01.03.2019, 3
2, 05.05.2018, 01.03.2018, 01.03.2019, 4
3, 07.06.2018, 01.07.2017, 01.07.2018, 5
3, 15.06.2018, 01.07.2017, 01.07.2018, 6
3, 29.06.2018, 01.07.2017, 01.07.2018, 7
4, 18.08.2018, 01.01.2018, 01.01.2019, 8
5, 11.10.2018, 01.01.2018, 01.01.2019, 9
6, 11.10.2018, 01.03.2018, 01.03.2019, 10
];
Left Join (Table)
IntervalMatch (REPAIR_DATE)
LOAD WARRANTY_START as WARRANTY_START_NEW,
WARRANTY_END as WARRANTY_END_NEW
Resident Table;
Left Join (Table)
LOAD WARRANTY_START as WARRANTY_START_NEW,
WARRANTY_END as WARRANTY_END_NEW,
ID as ID_NEW
Resident Table;
- Mark as New
- Bookmark
- Subscribe
- Mute
- Subscribe to RSS Feed
- Permalink
- Report Inappropriate Content
This might work slightly better
Table:
LOAD * INLINE [
ID, REPAIR_DATE, WARRANTY_START, WARRANTY_END, REPAIR_ID
1, 01.02.2018, 01.01.2018, 01.01.2019, 1
1, 15.03.2018, 01.01.2018, 01.01.2019, 2
2, 15.03.2018, 01.03.2018, 01.03.2019, 3
2, 05.05.2018, 01.03.2018, 01.03.2019, 4
3, 07.06.2018, 01.07.2017, 01.07.2018, 5
3, 15.06.2018, 01.07.2017, 01.07.2018, 6
3, 29.06.2018, 01.07.2017, 01.07.2018, 7
4, 18.08.2018, 01.01.2018, 01.01.2019, 8
5, 11.10.2018, 01.01.2018, 01.01.2019, 9
6, 11.10.2018, 01.03.2018, 01.03.2019, 10
];
Left Join (Table)
IntervalMatch (REPAIR_DATE)
LOAD DISTINCT WARRANTY_START as WARRANTY_START_NEW,
WARRANTY_END as WARRANTY_END_NEW
Resident Table;
Left Join (Table)
LOAD DISTINCT WARRANTY_START as WARRANTY_START_NEW,
WARRANTY_END as WARRANTY_END_NEW,
ID as ID_NEW
Resident Table;
- Mark as New
- Bookmark
- Subscribe
- Mute
- Subscribe to RSS Feed
- Permalink
- Report Inappropriate Content
Hey,
thank you very much for your answer!
I think it is getting to big, because there are several millions of observations and a three year time frame, so it will just blow up.
And also every product has additional informations like product group etc. so it should be possible to filter it and only get the number of products which are still in warranty on that date and are also in that product group, therefore it also doesn't work to aggregate first.
- Mark as New
- Bookmark
- Subscribe
- Mute
- Subscribe to RSS Feed
- Permalink
- Report Inappropriate Content
Ya, unfortunately, this will have performance issues... not sure if there is a better way to do this... may be rwunderlich or marcus_sommer have any ideas
- Mark as New
- Bookmark
- Subscribe
- Mute
- Subscribe to RSS Feed
- Permalink
- Report Inappropriate Content
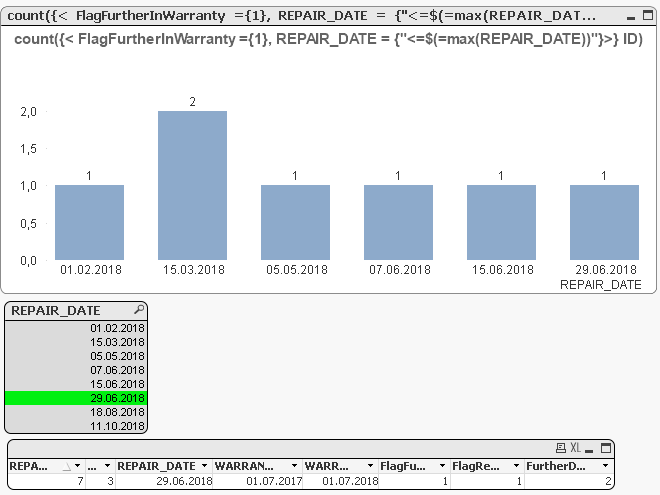
I could imagine that you could resolve your task with a flagging-approach within the data without getting too much trouble with the performance. I'm not sure if the following will already fullfil your requirements but if not it should be a good starting point to adjust it appropriate:
load
*,
-(REPAIR_DATE >= WARRANTY_START and REPAIR_DATE <= WARRANTY_END) as FlagRepairInWarranty,
-(REPAIR_DATE <= WARRANTY_END) as FlagFurtherInWarranty,
WARRANTY_END - REPAIR_DATE as FurtherDaysInWarranty;
LOAD * INLINE [
ID, REPAIR_DATE, WARRANTY_START, WARRANTY_END, REPAIR_ID
1, 01.02.2018, 01.01.2018, 01.01.2019, 1
1, 15.03.2018, 01.01.2018, 01.01.2019, 2
2, 15.03.2018, 01.03.2018, 01.03.2019, 3
2, 05.05.2018, 01.03.2018, 01.03.2019, 4
3, 07.06.2018, 01.07.2017, 01.07.2018, 5
3, 15.06.2018, 01.07.2017, 01.07.2018, 6
3, 29.06.2018, 01.07.2017, 01.07.2018, 7
4, 18.08.2018, 01.01.2018, 01.01.2019, 8
5, 11.10.2018, 01.01.2018, 01.01.2019, 9
6, 11.10.2018, 01.03.2018, 01.03.2019, 10
];
Possible adjustments might be to use conditions in regard to the previous records to build the flags properly, see here what is meant: Peek() or Previous() ?
- Marcus