Unlock a world of possibilities! Login now and discover the exclusive benefits awaiting you.
- Qlik Community
- :
- All Forums
- :
- QlikView App Dev
- :
- Re: Count of Mode in Straight Table
- Subscribe to RSS Feed
- Mark Topic as New
- Mark Topic as Read
- Float this Topic for Current User
- Bookmark
- Subscribe
- Mute
- Printer Friendly Page
- Mark as New
- Bookmark
- Subscribe
- Mute
- Subscribe to RSS Feed
- Permalink
- Report Inappropriate Content
Count of Mode in Straight Table
Hello,
I am displaying data in a straight table. I want to display the 'Mode' (most frequent occurrence) in one column and then the count or number of times that mode value has occurred in the next column.
I have the mode, but I can't figure out how to calculate the count of the mode value... any help would be greatly appreciated. Please see a sample data set attached. You can see a couple of my attempts to calculate the mode within the straight table.
Thanks!
Noelle
- « Previous Replies
-
- 1
- 2
- Next Replies »
Accepted Solutions
- Mark as New
- Bookmark
- Subscribe
- Mute
- Subscribe to RSS Feed
- Permalink
- Report Inappropriate Content
Hi Shivesh,
Thanks for the suggestions. After trying a few things i got this to work:
1. Added new field in script, Mode_NC:
TableJoin:
INNER JOIN (Table1)
Table2:
LOAD Model_Year, Model, Mode(NHTSA_Component) as Mode_NC
Resident Table1
Group By Model_Year, Model;
2. Added this expression to my straight table to calculate the % representation of the Mode complaint:
= aggr ( sum( if ( [Mode_NC] = [NHTSA_Component], 1, 0)), Model_Year, Model) / aggr (count ([NHTSA_Component] ), Model_Year , Model )
Thanks!
Noelle
- Mark as New
- Bookmark
- Subscribe
- Mute
- Subscribe to RSS Feed
- Permalink
- Report Inappropriate Content
Do you want to see count of mode in one column?
- Mark as New
- Bookmark
- Subscribe
- Mute
- Subscribe to RSS Feed
- Permalink
- Report Inappropriate Content
Hi Shivesh,
Thanks for the reply.
Yes, I want to determine how many times the mode value occurred, and place that count in a column in the table.
Thanks - Noelle
- Mark as New
- Bookmark
- Subscribe
- Mute
- Subscribe to RSS Feed
- Permalink
- Report Inappropriate Content
Can you share the sample data please?
- Mark as New
- Bookmark
- Subscribe
- Mute
- Subscribe to RSS Feed
- Permalink
- Report Inappropriate Content
For example, in the sample data set I provided, for vehicle 2017 V7 the most frequent complaint (or mode) is 'air bag' and this complaint occurred 5 times. So this 2016 V7 row should say '5' in the Count of Mode column.
Thanks - Noelle
- Mark as New
- Bookmark
- Subscribe
- Mute
- Subscribe to RSS Feed
- Permalink
- Report Inappropriate Content
The data is included in the qvw file attached in the original note.
Thanks - Noelle
- Mark as New
- Bookmark
- Subscribe
- Mute
- Subscribe to RSS Feed
- Permalink
- Report Inappropriate Content
Sorry  my qlik license is over, that's why asking for sample data.
Else i'll rep tomorrow 
- Mark as New
- Bookmark
- Subscribe
- Mute
- Subscribe to RSS Feed
- Permalink
- Report Inappropriate Content
Oh sure - here it is:
Sample_Dataset:
Load * inline
[
Model_Year, Model, NHTSA_Component, VOQ_Date
2012, V1, Air Bag, 20180101
2012, V2, Electrical, 20180201
2013, V3, Other, 20180101
2013, V3, Air Bag, 20180201
2014, V4, Steering, 20180401
2014, V1, Air Bag, 20180301
2015, V5, Other, 20180101
2015, V5, Other, 20180201
2015, V5, Other, 20180501
2015, V6, Electrical, 20180401
2016, V7, Air Bag, 20180101
2016, V7, Air Bag, 20180201
2016, V7, Air Bag, 20180301
2016, V7, Air Bag, 20180401
2016, V7, Air Bag, 20180501
2016, V7, Steering, 20180101
2016, V7, Steering, 20180501
2016, V7, Other, 20180201
2016, V7, Other, 20180401
2016, V7, Electrical, 20180501
2016, V4, Too Cool, 20180101
2016, V4, Too Cool, 20180301
];
Sample_2:
LOAD Model_Year, Model, NHTSA_Component, left(VOQ_Date, Len(VOQ_Date)-2) as New_VOQ_Date
Resident Sample_Dataset;
And here are a couple of methods i tried - neither worked.
=max(aggr(count(VOQ_Date), New_VOQ_Date))
=Mode( TOTAL Aggr( Count({<NHTSA_Component>}, Model_Year, Model))
Thanks - Noelle
- Mark as New
- Bookmark
- Subscribe
- Mute
- Subscribe to RSS Feed
- Permalink
- Report Inappropriate Content
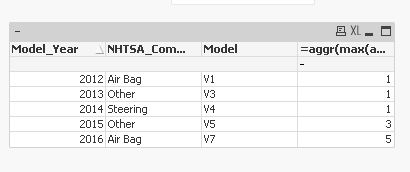
Hi
Try this
=aggr(max(aggr(count(Model),Model_Year,NHTSA_Component)),Model_Year)
- Mark as New
- Bookmark
- Subscribe
- Mute
- Subscribe to RSS Feed
- Permalink
- Report Inappropriate Content
This?
- « Previous Replies
-
- 1
- 2
- Next Replies »