Unlock a world of possibilities! Login now and discover the exclusive benefits awaiting you.
- Qlik Community
- :
- All Forums
- :
- QlikView App Dev
- :
- Re: Counting relative values
- Subscribe to RSS Feed
- Mark Topic as New
- Mark Topic as Read
- Float this Topic for Current User
- Bookmark
- Subscribe
- Mute
- Printer Friendly Page
- Mark as New
- Bookmark
- Subscribe
- Mute
- Subscribe to RSS Feed
- Permalink
- Report Inappropriate Content
Counting relative values
Hello everyone,
I am working in a chart where i need to count the porcentage of people of a field that measure the avarage of knowlodge of the employees.
The total of people are 202, and they are divided in 3 Departments:
Department A: 25
Department B: 105
Department C: 72
There is the expression of the bar chart:
count ([Avg of Knowledge])
And the chart displays the correct value when no filters are applied:

The user required to create a filter where it is possible to view each value of the volume (in percentage), so i have created the list below, using the field [Avg of Knowledge]:
So, for instance, the user selected all values under 80% to see how many people (in percentage) are under 80%:
After cheking my database, I have the following situation:
- The department A has 25 employees, and 25 are under 80%, so the chart should display 100%;
- The department B has 105 employess, and 98 are under 80%, so the chart should display 93%;
- The department C has 72 employees, and 70 are under 80%, so the chart should display 97%;
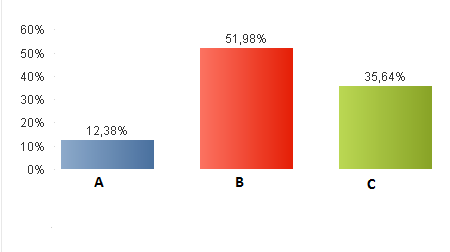
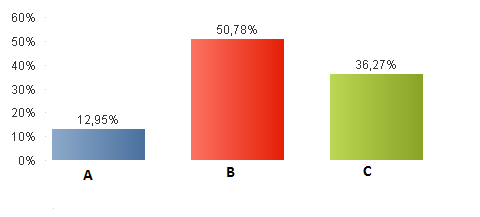
But the chart did not displayed to correct values from each department, as you can see below:

I am setting the Relative option on this chart.
Anyone could help to solve this problem?
Thanks
- « Previous Replies
-
- 1
- 2
- Next Replies »
- Mark as New
- Bookmark
- Subscribe
- Mute
- Subscribe to RSS Feed
- Permalink
- Report Inappropriate Content
May be try this:
=Count({1}[Avg of knowlegde]) / Count({1}TOTAL [Avg of knowledge])
- Mark as New
- Bookmark
- Subscribe
- Mute
- Subscribe to RSS Feed
- Permalink
- Report Inappropriate Content
Wiht this expression the chart seems frozen, the results didn´t change when i try to filter some value from the list box.
- Mark as New
- Bookmark
- Subscribe
- Mute
- Subscribe to RSS Feed
- Permalink
- Report Inappropriate Content
Hi Rodrigo,
Try this:
=Count({$}[Avg of knowlegde]) / Count({1}TOTAL [Avg of knowledge])
- Mark as New
- Bookmark
- Subscribe
- Mute
- Subscribe to RSS Feed
- Permalink
- Report Inappropriate Content
Rodrigo you replied to Stefan that this worked when you make a selection
=Count([Avg of knowlegde]) / Count({1} [Avg of knowledge])
and my solution worked when no selection is made?
=If(GetSelectedCount([Avg of knowlegde]) > 0,
Count([Avg of knowlegde]) / Count({1} [Avg of knowledge]), Count([Avg of knowlegde]) / Count(TOTAL [Avg of knowledge]))
But all I did was to add the condition that if nothing is selected show
Count([Avg of knowlegde]) / Count(TOTAL [Avg of knowledge])
Else if something is selected show what Stefan provided
=Count([Avg of knowlegde]) / Count({1} [Avg of knowledge])
Would you be able to verify if what Stefan provided initially worked or not?
- Mark as New
- Bookmark
- Subscribe
- Mute
- Subscribe to RSS Feed
- Permalink
- Report Inappropriate Content
Hi Sunny,
I don´t know why, but the condition proposed don´t display the same results as the results when i use them isolated.
The expression proposed by Stefan (=Count([Avg of knowlegde]) / Count({1} [Avg of knowledge])) worked when i make a selection (in this case i selected all the values that are under 80%):
If i clear all selections, the chart displays all bars as 100%, because as explained by swuehl, clearing a selection in a list box the calculation is equivalent to having all list box items selected.
When i use you solution worked when no selection is made, but when i select the same values under 80%, i have the following result:
As you can see, the chart didn´t display the values 100%, 93% and 97% as displayed in the solution proposed by Stefan.
- Mark as New
- Bookmark
- Subscribe
- Mute
- Subscribe to RSS Feed
- Permalink
- Report Inappropriate Content
Would it be possible for you to share a sample?
- Mark as New
- Bookmark
- Subscribe
- Mute
- Subscribe to RSS Feed
- Permalink
- Report Inappropriate Content
Hi Carlos,
Unfortunately your solution worked only when no selections are made.
After making the same selection under 80%, i had the following results:
- Mark as New
- Bookmark
- Subscribe
- Mute
- Subscribe to RSS Feed
- Permalink
- Report Inappropriate Content
Follow attached the sample!!
- Mark as New
- Bookmark
- Subscribe
- Mute
- Subscribe to RSS Feed
- Permalink
- Report Inappropriate Content
Please check the attached:
Without Selection
With Selection:
Expression:
=If(GetSelectedCount(Flag) > 0, Count([Avg of Knowledge]) / Count({1}[Avg of Knowledge]), Count([Avg of Knowledge]) / Count(TOTAL [Avg of Knowledge]))
- Mark as New
- Bookmark
- Subscribe
- Mute
- Subscribe to RSS Feed
- Permalink
- Report Inappropriate Content
Thanks a lot Sunny!
My mistake: I was not adding the field "Flag" in the condition:
=If(GetSelectedCount(Flag) > 0
- « Previous Replies
-
- 1
- 2
- Next Replies »