Unlock a world of possibilities! Login now and discover the exclusive benefits awaiting you.
- Qlik Community
- :
- All Forums
- :
- QlikView App Dev
- :
- Re: Create Bar chart
- Subscribe to RSS Feed
- Mark Topic as New
- Mark Topic as Read
- Float this Topic for Current User
- Bookmark
- Subscribe
- Mute
- Printer Friendly Page
- Mark as New
- Bookmark
- Subscribe
- Mute
- Subscribe to RSS Feed
- Permalink
- Report Inappropriate Content
Create Bar chart
Hi,
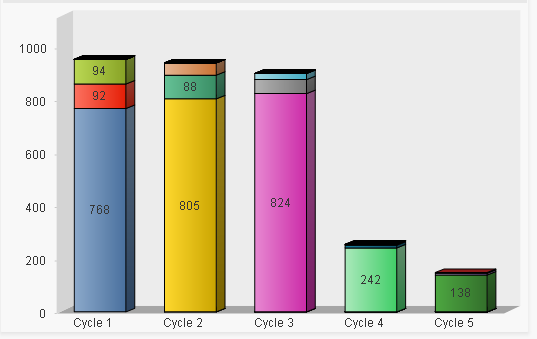
I need help in creating a bar chart as under
The Db table 'X' the chart is pointing to has following columns:
1) Column 'Cycles' that has values Cycle 1, Cycle 2 etc (it can go upto Cycle 'n')
2) Columns 'P', 'F', 'B'.
On the chart,
X axis to have cycles as separate bars based on the max value in Cycles column
Each cycle bar will have count of 'P', 'F', and 'B'.
What should be the expressions and dimensions for the chart?
Thanks in advance.
- Tags:
- new_to_qlikview
Accepted Solutions
- Mark as New
- Bookmark
- Subscribe
- Mute
- Subscribe to RSS Feed
- Permalink
- Report Inappropriate Content
Try one dimension, Cycles and three expressions:
=Count(P)
=Count(F)
=Count(B)
and set style to stacked in bar properties.
Or use a CROSSTABLE LOAD prefix in your script:
CROSSTABLE (Column, Value)
LOAD Cycles, P,F,B
FROM ...;
Then use dimensions Cycles and Column and as expression
=Count(Value)
- Mark as New
- Bookmark
- Subscribe
- Mute
- Subscribe to RSS Feed
- Permalink
- Report Inappropriate Content
Thanks a ton, Swuehl. The first option worked.