Unlock a world of possibilities! Login now and discover the exclusive benefits awaiting you.
- Qlik Community
- :
- All Forums
- :
- QlikView App Dev
- :
- Re: Creating a table and calculation
- Subscribe to RSS Feed
- Mark Topic as New
- Mark Topic as Read
- Float this Topic for Current User
- Bookmark
- Subscribe
- Mute
- Printer Friendly Page
- Mark as New
- Bookmark
- Subscribe
- Mute
- Subscribe to RSS Feed
- Permalink
- Report Inappropriate Content
Creating a table and calculation
Dear everyone
I have many different data that I fetched from different sources.
Now with the data, I want to make a table and to creat new column to calculate some of data next to column in the same table . For example, I have fetched working hours and wage for one hour. Now I want to create a new column that contains content which is working hours * wage for one hour. Can you tell me how I can do it? Which object should I use it?
Thank you in advance.
HJ
- Mark as New
- Bookmark
- Subscribe
- Mute
- Subscribe to RSS Feed
- Permalink
- Report Inappropriate Content
you can do it in two ways ...either at load script you perform the calculation simpally by multiplaying 2 fields
working hours * wage for one hour As New Column
Or you can do the same in expression tab using chart object etc
- Mark as New
- Bookmark
- Subscribe
- Mute
- Subscribe to RSS Feed
- Permalink
- Report Inappropriate Content
This is a very basic question.
Create a chart of type straight table and add a new column with expression working hours * wage
If you do not know how to do it, please add a sample app and I will show you.
- Mark as New
- Bookmark
- Subscribe
- Mute
- Subscribe to RSS Feed
- Permalink
- Report Inappropriate Content
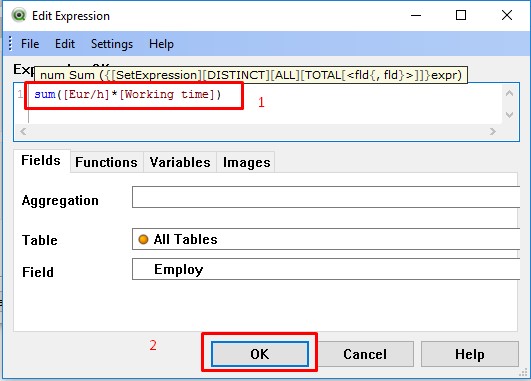
You can either load the calculation in your Load statement (1) or
calculate it in the tables (2).
Eg
(1)
Load
WorkingHours,
Wage,
WorkingHours * Wage As Payment
...
(2)
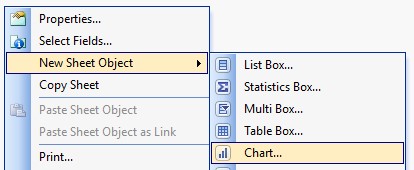
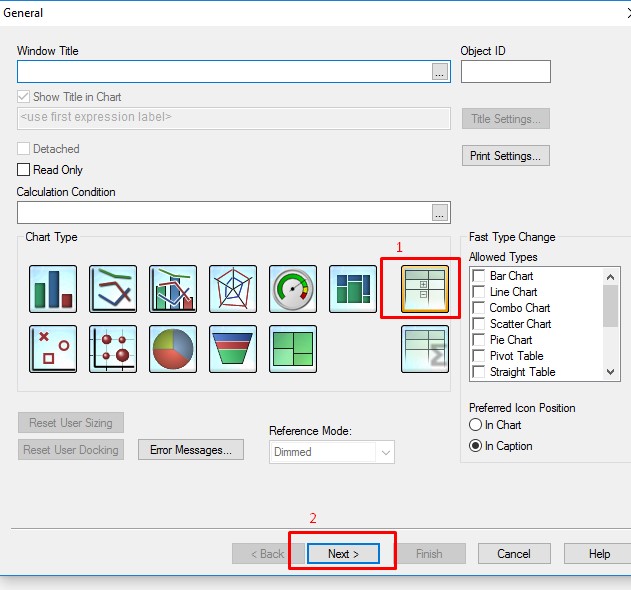
Open a new Chart -> straight table
Add under expressions
=WorkingHours * Wage
- Mark as New
- Bookmark
- Subscribe
- Mute
- Subscribe to RSS Feed
- Permalink
- Report Inappropriate Content
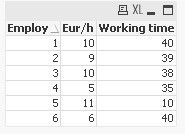
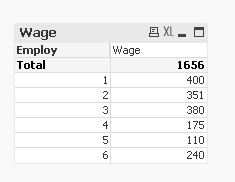
Take a look to the attachment below.
This is a Table object with the data you're interested. You may also be interested in dimension Year_month:
There is a simple instruction that will guide you to the result:
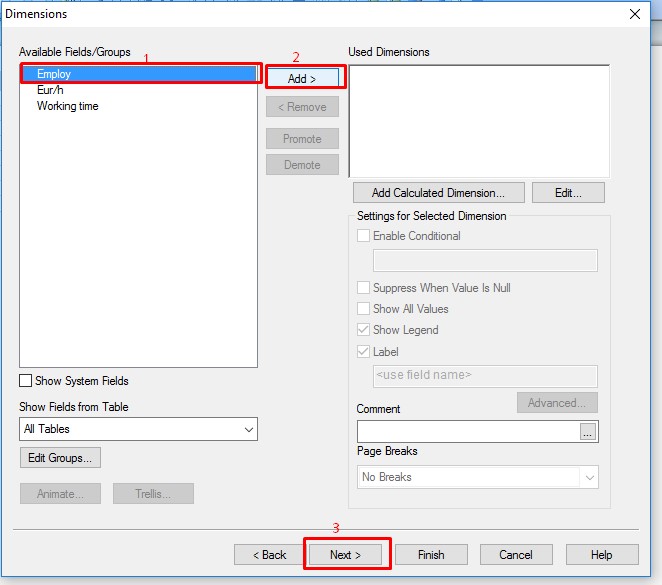
Finish and the outcome should something like this:
I suggest you reading Chart types ‒ QlikView