Unlock a world of possibilities! Login now and discover the exclusive benefits awaiting you.
- Qlik Community
- :
- All Forums
- :
- QlikView App Dev
- :
- Re: Cumulative quantity for each date/month betwee...
- Subscribe to RSS Feed
- Mark Topic as New
- Mark Topic as Read
- Float this Topic for Current User
- Bookmark
- Subscribe
- Mute
- Printer Friendly Page
- Mark as New
- Bookmark
- Subscribe
- Mute
- Subscribe to RSS Feed
- Permalink
- Report Inappropriate Content
Cumulative quantity for each date/month between a date range
Hi guys,
I'm trying to create a chart in Qlikview that gives the accumulated quantity for each date between a date range. Let me explain.
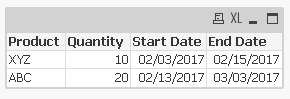
I've an excel data which I've loaded into Qlikview and it looks like this :
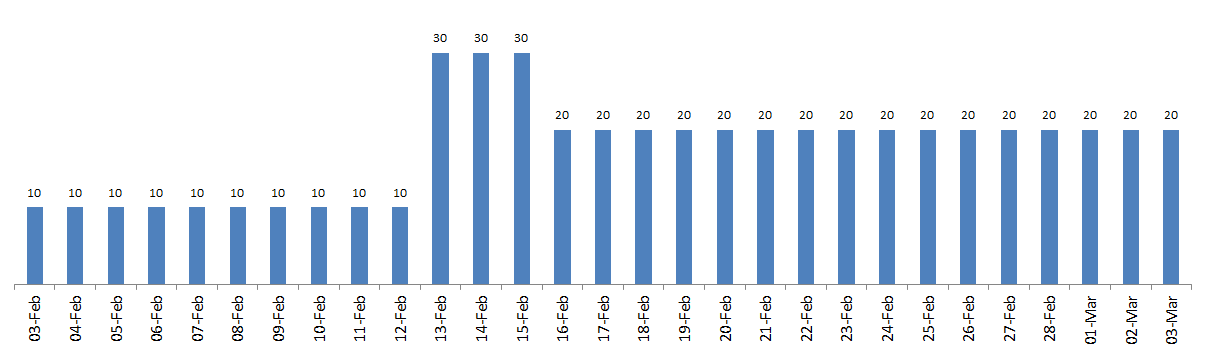
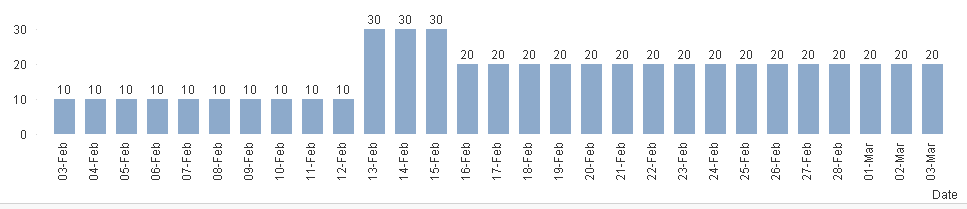
How can I create a bar chart from this data to look like this :
What if I want the accumulated quantity for each month between a date range ?
Any help would be much appreciated.
Thanks,
Ben
Accepted Solutions
- Mark as New
- Bookmark
- Subscribe
- Mute
- Subscribe to RSS Feed
- Permalink
- Report Inappropriate Content
Here you go
LOAD Quantity, Date(Date,'DD-MMM') as Date;
LOAD *, Date([Start Date] + IterNo() -1) as Date
While Date([Start Date] + IterNo() -1) <= [End Date];
LOAD * Inline [
Product, Quantity, Start Date, End Date
XYZ,10,02/03/2017, 02/15/2017
ABC,20, 02/13/2017, 03/03/2017
];
PS - Then, Create straight table with Date as Dimension and Sum(Quantity) as Expression
- Mark as New
- Bookmark
- Subscribe
- Mute
- Subscribe to RSS Feed
- Permalink
- Report Inappropriate Content
That worked Anil. Thanks 