Unlock a world of possibilities! Login now and discover the exclusive benefits awaiting you.
- Qlik Community
- :
- All Forums
- :
- QlikView App Dev
- :
- Re: Re: Customise Filters:Filteration should not i...
- Subscribe to RSS Feed
- Mark Topic as New
- Mark Topic as Read
- Float this Topic for Current User
- Bookmark
- Subscribe
- Mute
- Printer Friendly Page
- Mark as New
- Bookmark
- Subscribe
- Mute
- Subscribe to RSS Feed
- Permalink
- Report Inappropriate Content
Customise Filters:Filteration should not impact other columns
Hello,
In my current case where I have following Business Groups
- Affluent
- Expert Individuals
- TPGS
- New Customers
Then, each group has participants within it.. for example
Affluent : Cust ID1, Cust ID2, Cust ID3 etc
Expert Individuals : Cust ID4, Cust ID5, Cust ID6 etc
Above groups are mutually exclusive in terms of Cust ID
Objective: I am trying to compare the revenue pattern of Cust ID of one group(Say Affluent) against over all revenue pattern of Other Groups(TPGS/Expert Individuals/New Customers) using a straight table.
Challenge: If I am applying filter to any Cust ID then other groups are disappearing because it is just focusing on respective group.
Is it possible to make other groups appear after application of the filter?
I am trying to solve it using set analysis but not able to find the correct logic.
NOTE: I can't open QVD files from other users as I am using a trial version.
Kind Regards,
Varun
- Mark as New
- Bookmark
- Subscribe
- Mute
- Subscribe to RSS Feed
- Permalink
- Report Inappropriate Content
Hi Varun,
try to use so called "alternate states". These are like independed seletions rooms. Every chart and every list box can belong to a specific state (or, of course to the default state).
The document itself always belongs to the default state.
To use alternate states you have to create them first: document properties --> General Tab --> Button "Alternate States"
For ex create an "Affluent" and an "TPGS". After this they are available in most of your objects and a state can be bound to it where necessary. See for ex. Chart Prop --> General Tab.
And:
Alternate states can also be adressed within expressions.
For more Details pls refer to Online Help et. al.
HtH
Roland
- Mark as New
- Bookmark
- Subscribe
- Mute
- Subscribe to RSS Feed
- Permalink
- Report Inappropriate Content
Hi
This will hard code for affluent:
=Sum({<BusinessGroup={'Affluent'}>} Revenue) / Sum({<BusinessGroup=>} Revenue)
This will divide the selected group(s) by the sum of all:
=Sum(Revenue) / Sum({<BusinessGroup=>} Revenue)
In a chart with dimension BusinessGroup:
=Sum(Revenue) / Sum(TOTAL Revenue)
Change the field name and expression to match your data model.
HTH
Jonathan
- Mark as New
- Bookmark
- Subscribe
- Mute
- Subscribe to RSS Feed
- Permalink
- Report Inappropriate Content
Hello Varun,
I assume you are trying to put all the groups in one table and then compare the groups on Revenue.
Follow the steps below:
1. Add Group as dimension
2. Add an expression like
Sum({<CUST_ID=>} Revenue)
The above expression will make calculation independent of CUST_ID field selection. The caveat here is that the numbers for the respective group which has the selected CUST_ID will also not change.
If you wish to create different objects for each of the group, then Step 2 will be like:
Sum({<Group={'GROUP NAME', CUST_ID=>} Revenue)
Hope this helps.
- Mark as New
- Bookmark
- Subscribe
- Mute
- Subscribe to RSS Feed
- Permalink
- Report Inappropriate Content
Thanks Ronald,
I tried using Alternate states but it is duplicating the filters and I think Set Analysis might give better solution.
- Mark as New
- Bookmark
- Subscribe
- Mute
- Subscribe to RSS Feed
- Permalink
- Report Inappropriate Content
This is not working in a way I wanted.. I basically wanted to compare the revenue pattern of Cust ID from Affluent against Other business groups..
So Cust ID_Affluent vs. Expert Individuals or TPGS or New customers. I am not comparing against entire group
- Mark as New
- Bookmark
- Subscribe
- Mute
- Subscribe to RSS Feed
- Permalink
- Report Inappropriate Content
Hi again,
I am quite sure, that your problem can be solved by using different search states. In my example there are two of them important: "Gruppe1" and "Gruppe2".
The blue list boxes belong to state "Gruppe1" and orange belong to "Gruppe2".
Now check the SET Analyses in the expressions: Blue "Umsatz"-Bar is "Gruppe1"-bound and orange belongs to "Gruppe2"
Start playing around . . .
RR
- Mark as New
- Bookmark
- Subscribe
- Mute
- Subscribe to RSS Feed
- Permalink
- Report Inappropriate Content
I am still not able to get it right.
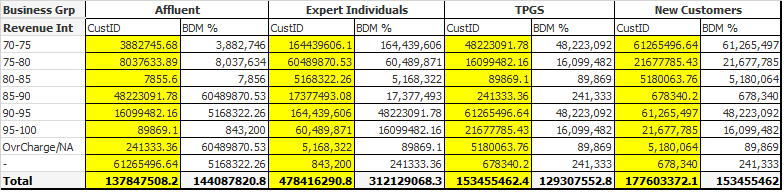
I need all yellow columns to reflect same values regardless of which Business group they belong too.
For eg:- If I select Cust ID from Expert Individuals then all yellow columns should reflect the values of that Cust ID.
I have tried writing the below set statements but they don't seem to work fine
Sum({<[Business Grp]=>} [Revenue])
or
Sum({<[Business Grp]={'Affluent', 'Expert Individuals', 'TPGS', 'New Customers'}>} [Revenue])
Thanks,
Varun