Unlock a world of possibilities! Login now and discover the exclusive benefits awaiting you.
- Qlik Community
- :
- All Forums
- :
- QlikView App Dev
- :
- Re: Data Manipulation (Switch Measure for Dimensio...
- Subscribe to RSS Feed
- Mark Topic as New
- Mark Topic as Read
- Float this Topic for Current User
- Bookmark
- Subscribe
- Mute
- Printer Friendly Page
- Mark as New
- Bookmark
- Subscribe
- Mute
- Subscribe to RSS Feed
- Permalink
- Report Inappropriate Content
Data Manipulation (Switch Measure for Dimension)
Hello everyone.. I have a set of data in this format...
| Location | Year | Quarter | UA | UC | RTA |
|---|---|---|---|---|---|
| Area 1 | 2015 | Q1 | 12 | 1 | 2 |
| Area 2 | 2015 | Q1 | 13 | 1 | 0 |
| Area 1 | 2015 | Q2 | 34 | 2 | 1 |
| Area 2 | 2015 | Q2 | 13 | 2 | 1 |
| Area 1 | 2015 | Q3 | 13 | 1 | 0 |
| Area 2 | 2015 | Q3 | 1 | 2 | 0 |
The above table is the Health ,safety and Environment stats for a store with two branches....
I need to represent the data in a pyramid form and a bar chart form.. see attached for clarity..
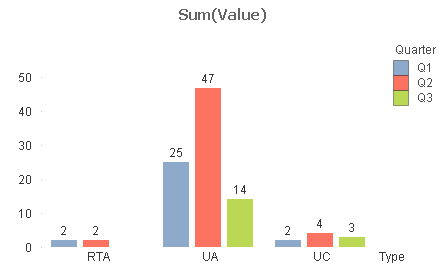
I don't know how to manipulate the data (using UA, UC as dimension and Quarter as Measures) see picture
thanks
- « Previous Replies
-
- 1
- 2
- Next Replies »
Accepted Solutions
- Mark as New
- Bookmark
- Subscribe
- Mute
- Subscribe to RSS Feed
- Permalink
- Report Inappropriate Content
- Mark as New
- Bookmark
- Subscribe
- Mute
- Subscribe to RSS Feed
- Permalink
- Report Inappropriate Content
I assume, Funnel chart don't capture the Text on Metric.
- Mark as New
- Bookmark
- Subscribe
- Mute
- Subscribe to RSS Feed
- Permalink
- Report Inappropriate Content
roharoha stalwar1jimhalpert
With the above table, How can I build a bar chart that has UA, UC as dimensions and Quarter as measure...
I used dimension as UA and count(quarter) but it doesn't the right result that matchs the visual in the attached file...
The desired visual
Use UA as dimension
Use Quarter as measures
To count the occurence of UA in each quarter...
Regards
- Mark as New
- Bookmark
- Subscribe
- Mute
- Subscribe to RSS Feed
- Permalink
- Report Inappropriate Content
I think you'll have to transform your data (Quarter as measure makes really no sense ![]() )
)
TEMP:
LOAD * INLINE [
Location, Year, Quarter, UA, UC, RTA
Area 1, 2015, Q1, 12, 1, 2
Area 2, 2015, Q1, 13, 1, 0
Area 1, 2015, Q2, 34, 2, 1
Area 2, 2015, Q2, 13, 2, 1
Area 1, 2015, Q3, 13, 1, 0
Area 2, 2015, Q3, 1, 2, 0
];
//Transform your data
FINAL:
LOAD Location, Year, Quarter, UA as Value, 'UA' as Type Resident TEMP;
LOAD Location, Year, Quarter, UC as Value, 'UC' as Type Resident TEMP;
LOAD Location, Year, Quarter, RTA as Value, 'RTA' as Type Resident TEMP;
DROP Table TEMP;

- Mark as New
- Bookmark
- Subscribe
- Mute
- Subscribe to RSS Feed
- Permalink
- Report Inappropriate Content
This is my desired result but the data transformation is quite cumbersome..... I have about 385 rows, 11 columns of data to import to qlikview... Is there any way I can transform the data?
roharoha Thank you sir for your guide...
Regards
- Mark as New
- Bookmark
- Subscribe
- Mute
- Subscribe to RSS Feed
- Permalink
- Report Inappropriate Content
You have to do it the same way as in my example...
You need 11 lines like that:
LOAD Location, Year, Quarter, MEASURE1 as Value, 'MEASURE1' as Type Resident TEMP;
concatenate
LOAD Location, Year, Quarter, MEASURE2 as Value, 'MEASURE1' as Type Resident TEMP;
,,,
concatenate
LOAD Location, Year, Quarter, MEASURE11 as Value, 'MEASURE11' as Type Resident TEMP;
... I can't help you any further without sample data.
- Mark as New
- Bookmark
- Subscribe
- Mute
- Subscribe to RSS Feed
- Permalink
- Report Inappropriate Content
I can do what you did in the above example... but my data source is SQL...
With your approach, I have to manually transform the data...
Is it possible to transform this data from an external source like sql or even an excel file?
- Mark as New
- Bookmark
- Subscribe
- Mute
- Subscribe to RSS Feed
- Permalink
- Report Inappropriate Content
You can transform SQL Tables the same way as Excel Files or Inline Tables...
I can only give you an idea how to solve it...
- Mark as New
- Bookmark
- Subscribe
- Mute
- Subscribe to RSS Feed
- Permalink
- Report Inappropriate Content
Not sure but did you try transforming through cross table?
- Mark as New
- Bookmark
- Subscribe
- Mute
- Subscribe to RSS Feed
- Permalink
- Report Inappropriate Content
You can use crosstable in following way:
TEMP:
CrossTable(Type, Value, 3)
LOAD * INLINE [
Location, Year, Quarter, UA, UC, RTA
Area 1, 2015, Q1, 12, 1, 2
Area 2, 2015, Q1, 13, 1, 0
Area 1, 2015, Q2, 34, 2, 1
Area 2, 2015, Q2, 13, 2, 1
Area 1, 2015, Q3, 13, 1, 0
Area 2, 2015, Q3, 1, 2, 0
];
- « Previous Replies
-
- 1
- 2
- Next Replies »