Unlock a world of possibilities! Login now and discover the exclusive benefits awaiting you.
- Qlik Community
- :
- All Forums
- :
- QlikView App Dev
- :
- Re: Date shows as 1900
- Subscribe to RSS Feed
- Mark Topic as New
- Mark Topic as Read
- Float this Topic for Current User
- Bookmark
- Subscribe
- Mute
- Printer Friendly Page
- Mark as New
- Bookmark
- Subscribe
- Mute
- Subscribe to RSS Feed
- Permalink
- Report Inappropriate Content
Date shows as 1900
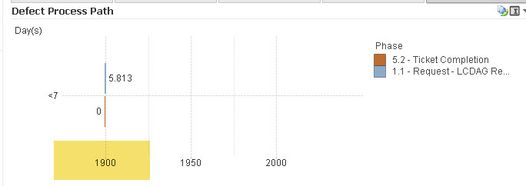
This date field works fine everywhere else but in this new chart, it shows as 1900. I added date#() in the script but it didn't fix it.
Script:
date("ADJ_GOVERNANCE_PHASE_START_DATE", 'MM/DD/YYYY') as ADJ_GOVERNANCE_PHASE_START_DATE,
Dashboard displays all as 1900
Chart Dimensions: (ADJ_GOVERNANCE_PHASE_START_DATE)
Chart expression: if(isnull(ADJ_GOVERNANCE_PHASE_END_DATE),ADJ_GOVERNANCE_PHASE_START_DATE-date(today()),ADJ_GOVERNANCE_PHASE_TAT)
- « Previous Replies
-
- 1
- 2
- Next Replies »
Accepted Solutions
- Mark as New
- Bookmark
- Subscribe
- Mute
- Subscribe to RSS Feed
- Permalink
- Report Inappropriate Content
@cbaqir In chart properties->Axis-> Static Min and Static Max expression causing this issue. Uncheck that
- Mark as New
- Bookmark
- Subscribe
- Mute
- Subscribe to RSS Feed
- Permalink
- Report Inappropriate Content
What's the output in ADJ_GOVERNANCE_PHASE_START_DATE? You need to ensure it hold a date value.
You are saying that you are using date#(), but your definition is written without #.
Try this to verify that your field is a date.
Date (date#("ADJ_GOVERNANCE_PHASE_START_DATE", 'MM/DD/YYYY')) as ADJ_GOVERNANCE_PHASE_START_DATE,
Qlik Community MVP
- Mark as New
- Bookmark
- Subscribe
- Mute
- Subscribe to RSS Feed
- Permalink
- Report Inappropriate Content
Unfortunately, that did not make a difference.
- Mark as New
- Bookmark
- Subscribe
- Mute
- Subscribe to RSS Feed
- Permalink
- Report Inappropriate Content
I use that field in lots of other places and it works fine. I'm not sure why this view does not show it correctly.
- Mark as New
- Bookmark
- Subscribe
- Mute
- Subscribe to RSS Feed
- Permalink
- Report Inappropriate Content
QVW Attached
- Mark as New
- Bookmark
- Subscribe
- Mute
- Subscribe to RSS Feed
- Permalink
- Report Inappropriate Content
@cbaqir In chart properties->Axis-> Static Min and Static Max expression causing this issue. Uncheck that
- Mark as New
- Bookmark
- Subscribe
- Mute
- Subscribe to RSS Feed
- Permalink
- Report Inappropriate Content
That definitely fixed part of the issue! Thanks. The dates still aren't formatted correctly though. Any idea?
- Mark as New
- Bookmark
- Subscribe
- Mute
- Subscribe to RSS Feed
- Permalink
- Report Inappropriate Content
@cbaqir that probably due to Date# applied. As you already formatted that field as Date no need to use Date#
- Mark as New
- Bookmark
- Subscribe
- Mute
- Subscribe to RSS Feed
- Permalink
- Report Inappropriate Content
That doesn't seem to fix it.
- Mark as New
- Bookmark
- Subscribe
- Mute
- Subscribe to RSS Feed
- Permalink
- Report Inappropriate Content
@Kushal_Chawda Close but not quite. I've been playing with this: =if(not match(ADJ_GOVERNANCE_PHASE,'5.2 - Ticket Completion'), date(ADJ_GOVERNANCE_PHASE_START_DATE,'M/D/YYYY'))
- « Previous Replies
-
- 1
- 2
- Next Replies »


