Unlock a world of possibilities! Login now and discover the exclusive benefits awaiting you.
- Qlik Community
- :
- All Forums
- :
- QlikView App Dev
- :
- Re: Date sort order in line chart
- Subscribe to RSS Feed
- Mark Topic as New
- Mark Topic as Read
- Float this Topic for Current User
- Bookmark
- Subscribe
- Mute
- Printer Friendly Page
- Mark as New
- Bookmark
- Subscribe
- Mute
- Subscribe to RSS Feed
- Permalink
- Report Inappropriate Content
Date sort order in line chart
Hi all, this is driving me crazy :S I've tried everything that came to my mind, I combining 2 years in 1 chart using just month-day as dimension, but I cannot manage to get it sorted correctly, I'm already ordering by date field in load script and sort property in the dimension, but still, the dates not matching. Those at the end happen to be those days that were reported just in one year but not the other, any idea on how to solve this? Thanks in advance!
Dimension: Month([Report Date]) & '-' & Day([Report Date])
Sort: Expression -> [Report date]
I've also tried to create the dimension as text in load script and sort by load order but I'm getting the same result.
![]()
- Mark as New
- Bookmark
- Subscribe
- Mute
- Subscribe to RSS Feed
- Permalink
- Report Inappropriate Content
Thanks Manish but it didn't work, it gave me even weirder results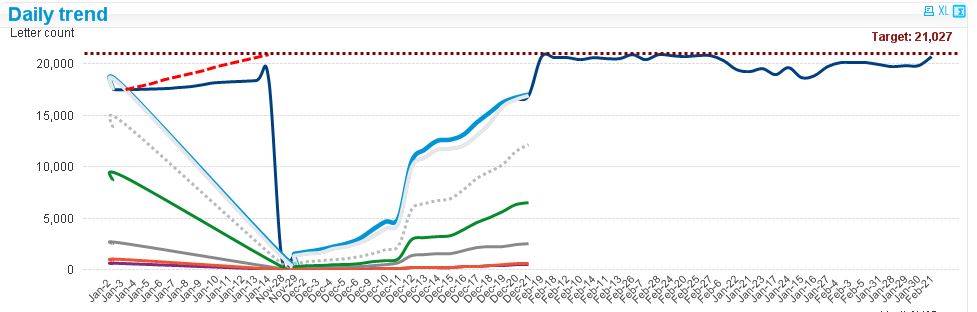
- Mark as New
- Bookmark
- Subscribe
- Mute
- Subscribe to RSS Feed
- Permalink
- Report Inappropriate Content
Provide sample data.... please
- Mark as New
- Bookmark
- Subscribe
- Mute
- Subscribe to RSS Feed
- Permalink
- Report Inappropriate Content
Here's is the sample file
- Mark as New
- Bookmark
- Subscribe
- Mute
- Subscribe to RSS Feed
- Permalink
- Report Inappropriate Content
Change in script as below
date([Report Date],'MMM-DD-YYYY') as [Report Date],
and try again..
- Mark as New
- Bookmark
- Subscribe
- Mute
- Subscribe to RSS Feed
- Permalink
- Report Inappropriate Content
can you see the file ...
- Mark as New
- Bookmark
- Subscribe
- Mute
- Subscribe to RSS Feed
- Permalink
- Report Inappropriate Content
Hi Enrique,
It is still not sorted correctly 
- Mark as New
- Bookmark
- Subscribe
- Mute
- Subscribe to RSS Feed
- Permalink
- Report Inappropriate Content
The only change is -dd- by -DD-?
I did it but nothing changed....
- Mark as New
- Bookmark
- Subscribe
- Mute
- Subscribe to RSS Feed
- Permalink
- Report Inappropriate Content
if you add the year?
- Mark as New
- Bookmark
- Subscribe
- Mute
- Subscribe to RSS Feed
- Permalink
- Report Inappropriate Content
That's not the approach I want to overlap both years in 1 chart
- Mark as New
- Bookmark
- Subscribe
- Mute
- Subscribe to RSS Feed
- Permalink
- Report Inappropriate Content
I ran in to the same problem. I used Date(MonthStart(DateField), 'MMM-YYYY') to resolve my issue.