Unlock a world of possibilities! Login now and discover the exclusive benefits awaiting you.
- Qlik Community
- :
- All Forums
- :
- QlikView App Dev
- :
- Re: Dates in a chart
- Subscribe to RSS Feed
- Mark Topic as New
- Mark Topic as Read
- Float this Topic for Current User
- Bookmark
- Subscribe
- Mute
- Printer Friendly Page
- Mark as New
- Bookmark
- Subscribe
- Mute
- Subscribe to RSS Feed
- Permalink
- Report Inappropriate Content
Dates in a chart
Hello,
I have an question. When i have a barchart with dates from lets say: september 1st to today. Then i have a lot of dates. More dates that there can be on the barchart.
How can i do so it always no matter what ends on todays date?
Cause I have seen when there is too many dates, sometimes the last date on the chart is not my actual enddate - But it is different from time to time.
- « Previous Replies
-
- 1
- 2
- Next Replies »
Accepted Solutions
- Mark as New
- Bookmark
- Subscribe
- Mute
- Subscribe to RSS Feed
- Permalink
- Report Inappropriate Content
once Continuous is ticked go to the Number tab and select Continuous X-axis and format it to a Date
- Mark as New
- Bookmark
- Subscribe
- Mute
- Subscribe to RSS Feed
- Permalink
- Report Inappropriate Content
Hi,
First check the sorting that you have on the chart. Make sure that the sorting is such that the dates are in ascending order. This way, you will always get the current date as the last bar. To do this, you can select the option sort by expression and then use an expression like below with the order being ascending.
=Max({1} FiscalDate)
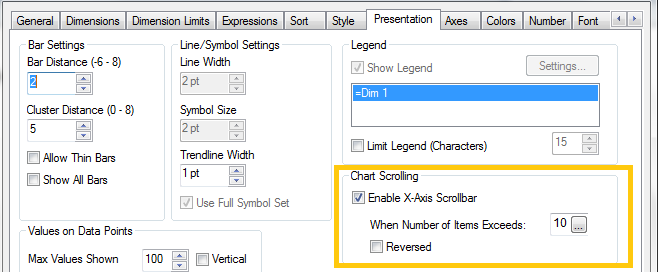
Second, to display the bars properly when you have a lot of bars, use the option below to enable a scroll so that you have acceptable number of bars on the view all the time.
Hope this helps.
Regards,
Aadil
- Mark as New
- Bookmark
- Subscribe
- Mute
- Subscribe to RSS Feed
- Permalink
- Report Inappropriate Content
If i sort Descending (which is the wrong way) i get the newest date. If i sort ascending (which is correct way) i only get dates to like the 22th of november.
By the way i meant linechart. I can only see the newest date if i make my chart bigger (but i dont want to do that)
- Mark as New
- Bookmark
- Subscribe
- Mute
- Subscribe to RSS Feed
- Permalink
- Report Inappropriate Content
Well, either way, if you are able to view the current dates on the right and it goes all the way to your left with dates in descending, i guess that should do fine and with the scroll bar you should be able to scroll to see the entire trend of dates. Do you not?
- Mark as New
- Bookmark
- Subscribe
- Mute
- Subscribe to RSS Feed
- Permalink
- Report Inappropriate Content
YES - But i would really like to avoid the scrollbars..... But maybe thats not possible.
- Mark as New
- Bookmark
- Subscribe
- Mute
- Subscribe to RSS Feed
- Permalink
- Report Inappropriate Content
Well, You either show all the dates, or show the current year dates or for any particular period, or you have the scroll bar. I guess, you just have to decide which works out to be good based on what the users will look for mostly out of this chart.
Regards,
Aadil
- Mark as New
- Bookmark
- Subscribe
- Mute
- Subscribe to RSS Feed
- Permalink
- Report Inappropriate Content
The problem is - The whole picture is important info - But monthly basis is also. So on a monthly basis there will be no problem. But to see all life time data in the chart will be a problem cause it then cut off dates.
If i set up scrollbars it will work, but how can i set the scrollbar to start at my newest date? Cause when i say for example use scrollbar when exceed of 60 dates. The scrollbar start at the lowest date. Or is that not possible.
- Mark as New
- Bookmark
- Subscribe
- Mute
- Subscribe to RSS Feed
- Permalink
- Report Inappropriate Content
Check the "Reversed" box on the picture above.
- Mark as New
- Bookmark
- Subscribe
- Mute
- Subscribe to RSS Feed
- Permalink
- Report Inappropriate Content
you could tick Continuous on the Axes tab under the Dimension Axis header in Chart properties which will allow you to scale the axes as a continuous numeric so no matter how small you make the chart it will scale to show all values and the date will just roll up to fit accordingly
- Mark as New
- Bookmark
- Subscribe
- Mute
- Subscribe to RSS Feed
- Permalink
- Report Inappropriate Content
No affect
- « Previous Replies
-
- 1
- 2
- Next Replies »