Unlock a world of possibilities! Login now and discover the exclusive benefits awaiting you.
- Qlik Community
- :
- All Forums
- :
- QlikView App Dev
- :
- Days and hours in Bar chart
- Subscribe to RSS Feed
- Mark Topic as New
- Mark Topic as Read
- Float this Topic for Current User
- Bookmark
- Subscribe
- Mute
- Printer Friendly Page
- Mark as New
- Bookmark
- Subscribe
- Mute
- Subscribe to RSS Feed
- Permalink
- Report Inappropriate Content
Days and hours in Bar chart
Hi Team,
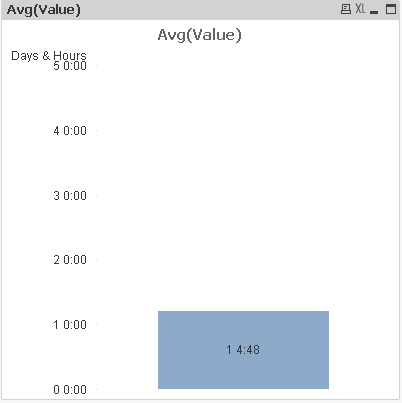
I have a value of 1.2 which i'm able to show it in Bar chart.
But i wanna show it as 1 day and 4.8 Hrs. (0.2*24) = 4.8
Since this is not a unit, i'm not able to visualize in bar chart.
Can someone please help?
Any help is highly appreciated!!
Please see attachment.
Accepted Solutions
- Mark as New
- Bookmark
- Subscribe
- Mute
- Subscribe to RSS Feed
- Permalink
- Report Inappropriate Content
Hi,
SET ThousandSep=',';
SET DecimalSep='.';
SET MoneyThousandSep=',';
SET MoneyDecimalSep='.';
SET MoneyFormat='$#,##0.00;($#,##0.00)';
SET TimeFormat='h:mm:ss TT';
SET DateFormat='M/D/YYYY';
SET TimestampFormat='M/D/YYYY h:mm:ss[.fff] TT';
SET MonthNames='Jan;Feb;Mar;Apr;May;Jun;Jul;Aug;Sep;Oct;Nov;Dec';
SET DayNames='Mon;Tue;Wed;Thu;Fri;Sat;Sun';
LOAD * Inline
[
Id, Value
1, 1.2
2, 2.3
3, 3.4
4, 1.5
];
bar expression
=dual((Floor(Avg({<Id>}Value)) & ' Day ' & Ceil(Avg({<Id>}Value)) * 2.4 & ' Hours'), Avg({<Id>}Value))
- Mark as New
- Bookmark
- Subscribe
- Mute
- Subscribe to RSS Feed
- Permalink
- Report Inappropriate Content
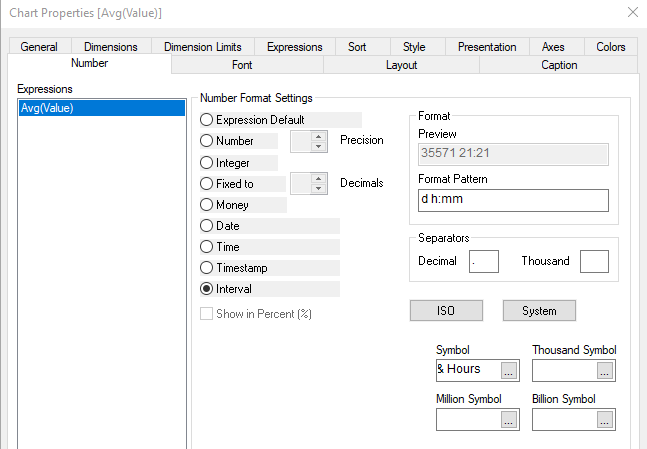
You can format the value as an Interval.


- Mark as New
- Bookmark
- Subscribe
- Mute
- Subscribe to RSS Feed
- Permalink
- Report Inappropriate Content
Hi Mark,
If you have found a solution then can you please close the thread.
Thanks & Regards,
Vijay
- Mark as New
- Bookmark
- Subscribe
- Mute
- Subscribe to RSS Feed
- Permalink
- Report Inappropriate Content
Sorry for the delay.
I just marked it as closed.
- Mark as New
- Bookmark
- Subscribe
- Mute
- Subscribe to RSS Feed
- Permalink
- Report Inappropriate Content
Thansk for your help Rob! ![]()