Unlock a world of possibilities! Login now and discover the exclusive benefits awaiting you.
- Qlik Community
- :
- All Forums
- :
- QlikView App Dev
- :
- Re: Default Year in Qlikview
- Subscribe to RSS Feed
- Mark Topic as New
- Mark Topic as Read
- Float this Topic for Current User
- Bookmark
- Subscribe
- Mute
- Printer Friendly Page
- Mark as New
- Bookmark
- Subscribe
- Mute
- Subscribe to RSS Feed
- Permalink
- Report Inappropriate Content
Default Year in Qlikview
Hi,
I have a chart where we are showing Sales by Region. We have a filter on Year and Month.
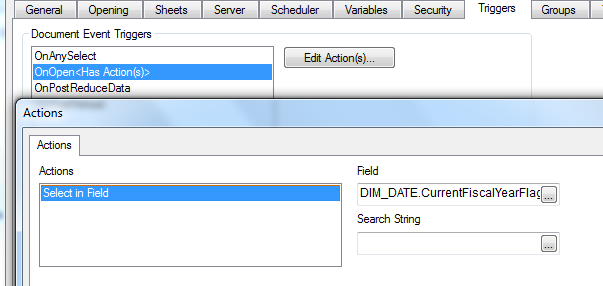
We need to make it as default selection as Current Year and Current Month.
In Date table we have two flag called Current Year Flag and Current Month Flag. If Flag value is 1, then it shows Current Year and Current Month.
How can we implement this.
We cant use max Year or max Month, as Date table has date till 2036 year.
Please suggest.
Thanks,
Sarif
- « Previous Replies
-
- 1
- 2
- Next Replies »
- Mark as New
- Bookmark
- Subscribe
- Mute
- Subscribe to RSS Feed
- Permalink
- Report Inappropriate Content
Hi Shiva,
In this case we will get data on Calendar Year basis. But we need to show on Fiscal year Basis.

Please help.
Thanks,
Sarif
- Mark as New
- Bookmark
- Subscribe
- Mute
- Subscribe to RSS Feed
- Permalink
- Report Inappropriate Content
So for example if your fiscal year is from 1st july to 31st of june, you can select in year field like if(Month(Today())>=7, year(Today())+1,Year(today())). just the same method you used to create the fiscal year field from the date field in your calender.
Hope it helps!
- Mark as New
- Bookmark
- Subscribe
- Mute
- Subscribe to RSS Feed
- Permalink
- Report Inappropriate Content
okk.. got it Shiva..
But if I put simple CurrentYearfLag =1 , then also it is not behaving as expected.

Am I doing correct?
Please help.
Thanks,
Sarif
- Mark as New
- Bookmark
- Subscribe
- Mute
- Subscribe to RSS Feed
- Permalink
- Report Inappropriate Content
Try the following:
sum({<Year =, CurrentYearFlag= {1}>}Sales)
- Mark as New
- Bookmark
- Subscribe
- Mute
- Subscribe to RSS Feed
- Permalink
- Report Inappropriate Content
hi,
as data tables has dates till 2036, you can use =Date(Max(DSTDTE), 'MMM-YYYY') to display the greatest value from the data.
or =Date(Today(),'MMM-YYYY') for current values.
happy Qliking.
- Mark as New
- Bookmark
- Subscribe
- Mute
- Subscribe to RSS Feed
- Permalink
- Report Inappropriate Content
Mohammad, If the date table is like current year when flag =1 , why is that 2016 and 2017 are available in Current year filter and 2017 is fiscal year?? I think they should be reverse i guess.
- « Previous Replies
-
- 1
- 2
- Next Replies »