Unlock a world of possibilities! Login now and discover the exclusive benefits awaiting you.
- Qlik Community
- :
- All Forums
- :
- QlikView App Dev
- :
- Difference can't get filtered
- Subscribe to RSS Feed
- Mark Topic as New
- Mark Topic as Read
- Float this Topic for Current User
- Bookmark
- Subscribe
- Mute
- Printer Friendly Page
- Mark as New
- Bookmark
- Subscribe
- Mute
- Subscribe to RSS Feed
- Permalink
- Report Inappropriate Content
Difference can't get filtered
Hi Everyone,
I have a situation here. Below the two formulas I am using for the two list boxes.
For Dec Active = =if(d2.month=12 and d2.linestatus='Active', d1cust.clientid)
For Dec Replaced = =if(d2.month=12 and d2.linestatus='Replaced', d1cust.clientid).
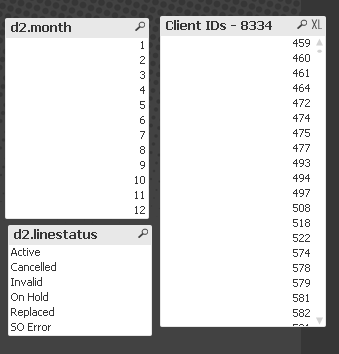
I am counting the lines within the list boxes using the count formula...the reason for the 72K and the 8K.
My goal is to find the numbers which are present in the Replaced box to be filtered out in the Active. When I do Select All on the replaced box the Active box gets grayed out. A replaced line gets substituted with an Active line so I want to see which of the Replaced Lines ended up as Active line.
Thanks in Advance.
- Tags:
- new_to_qlikview
Accepted Solutions
- Mark as New
- Bookmark
- Subscribe
- Mute
- Subscribe to RSS Feed
- Permalink
- Report Inappropriate Content
You could try creating a list box with a field expression like
=Aggr(
Only(
{<d1cust.clientid = p({<d2.month={12},d2.linestatus={'Active'}>}) *p({<d2.month={12},d2.linestatus={'Replaced'}>}) >} d1cust.clientid)
, d1cust.clientid)
- Mark as New
- Bookmark
- Subscribe
- Mute
- Subscribe to RSS Feed
- Permalink
- Report Inappropriate Content
Create three list boxes for month, linestatus and clientid.
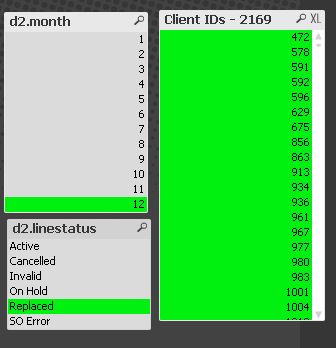
Now select month=12 and linestatus=Active. Then 'Select Possible' on clientid lisbox. Then select linestatus = Replaced. Now only the clientids which changed from Replaced to Active in month 12 should be selected.
- Mark as New
- Bookmark
- Subscribe
- Mute
- Subscribe to RSS Feed
- Permalink
- Report Inappropriate Content
Hi,
Would you post a sample data here or your app?
Thanks
- Mark as New
- Bookmark
- Subscribe
- Mute
- Subscribe to RSS Feed
- Permalink
- Report Inappropriate Content
Hi,
Is there any formula I can use instead of making three list boxes you have recommended above. I am attaching three images. One with no selection the second one with month 12 Active and Select Possible Client IDs and the third with Replaced Line status? I want to make it as feasible as possible for the non technical end users.
Thanks in advance

- Mark as New
- Bookmark
- Subscribe
- Mute
- Subscribe to RSS Feed
- Permalink
- Report Inappropriate Content
You could try creating a list box with a field expression like
=Aggr(
Only(
{<d1cust.clientid = p({<d2.month={12},d2.linestatus={'Active'}>}) *p({<d2.month={12},d2.linestatus={'Replaced'}>}) >} d1cust.clientid)
, d1cust.clientid)
- Mark as New
- Bookmark
- Subscribe
- Mute
- Subscribe to RSS Feed
- Permalink
- Report Inappropriate Content
Thanks for all your help Stephen. This project I am currently working on is quite a task. The data has become array and there is no easy filtering available. Thanks for your formulas appreciate the help. As a request, can you explain the formula above especially the p this is totally new to me I have tried looking it up on the reference guide but couldn't find it.
- Mark as New
- Bookmark
- Subscribe
- Mute
- Subscribe to RSS Feed
- Permalink
- Report Inappropriate Content
It's described in the HELP, chapter 'Set Analysis', it's detailed in sub-chapter 'Set Modifiers with Implicit Field Value Definitions'.
The p() function is the set analysis analogon to 'Select possible values' in the list box context menu.
Also read about the set operators, *,/,+,- that are also described in the 'Set Analysis' chapter.