Unlock a world of possibilities! Login now and discover the exclusive benefits awaiting you.
- Qlik Community
- :
- All Forums
- :
- QlikView App Dev
- :
- Re: Different color in the inside of a radar chart...
- Subscribe to RSS Feed
- Mark Topic as New
- Mark Topic as Read
- Float this Topic for Current User
- Bookmark
- Subscribe
- Mute
- Printer Friendly Page
- Mark as New
- Bookmark
- Subscribe
- Mute
- Subscribe to RSS Feed
- Permalink
- Report Inappropriate Content
Different color in the inside of a radar chart?
Hi,
Is there a way to change the color in the inside of a radar chart? I don't want to color the whole background and I don't want the other design mode with an empty inside. I mean that the surrounding line of the graph should be in one color, and the area enclosed by it in another color. What do you think?
Thanks a lot,
Martin
- « Previous Replies
-
- 1
- 2
- Next Replies »
- Mark as New
- Bookmark
- Subscribe
- Mute
- Subscribe to RSS Feed
- Permalink
- Report Inappropriate Content
I hope you wanted the chart to look like this:-
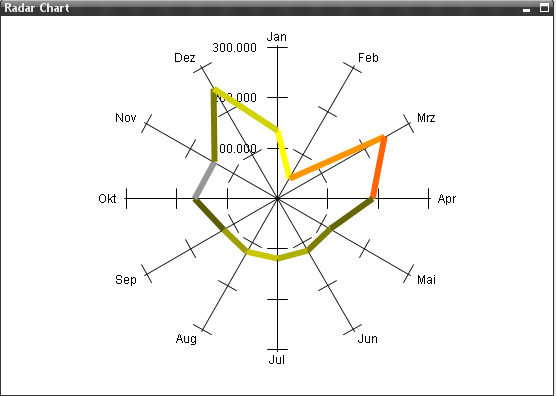
If this is exactly what you wanted, then the easiest method of doing this is to go to the chart expression and click + sign. You will find an option called "Background Color". Simply you can write the following expression here:-
if(Month='Jan', argb(255, 255, 255, 0),
if(Month='Feb', argb(255, 255, 150, 0),
if(Month='Mrz', argb(255, 255, 100, 0),
if(Month='Apr', argb(255, 100, 100, 0),
if(Month='Mai', argb(255, 125, 125, 0),
if(Month='Jun', argb(255, 175, 175, 0),
if(Month='Jul', argb(255, 199, 199, 0),
if(Month='Aug', argb(255, 158, 158, 0),
if(Month='Sep', argb(255, 90, 90, 0),
if(Month='Oct', argb(255, 115, 115, 0),
if(Month='Nov', argb(255, 123, 123, 0),
if(Month='Dez', argb(255, 210, 210, 0),
argb(255, 150, 150, 150)))))))))))))
You can choose the color of your choice. I also made the line width at 5 from the presentation tab.
Thanks
Vineet
- Mark as New
- Bookmark
- Subscribe
- Mute
- Subscribe to RSS Feed
- Permalink
- Report Inappropriate Content
Hi Kaushik and Vineet,
it looks like there is no way to achieve want I meant, I will just leave it as it is. Nevertheless thanks a lot for your help.
Kind regards,
Martin
- « Previous Replies
-
- 1
- 2
- Next Replies »