Unlock a world of possibilities! Login now and discover the exclusive benefits awaiting you.
- Qlik Community
- :
- All Forums
- :
- QlikView App Dev
- :
- Re: Dimension Value on Data Point of the Line Cha...
- Subscribe to RSS Feed
- Mark Topic as New
- Mark Topic as Read
- Float this Topic for Current User
- Bookmark
- Subscribe
- Mute
- Printer Friendly Page
- Mark as New
- Bookmark
- Subscribe
- Mute
- Subscribe to RSS Feed
- Permalink
- Report Inappropriate Content
Dimension Value on Data Point of the Line Chart
Hi,
I have a Line chart which is a daily trend. I am displaying the Data values only on those data points where date = Month End Date.
Now, the challenge is I need to show the DATE as well on the Data Point. I have tried by creating a new Expression and then showing it as a Data Value, but it works only if I have 1 Line in the graph, but I have multiple expressions and multiple lines on the graph.
Please suggest if any method to do this.
I have attached the expected result.
Thanks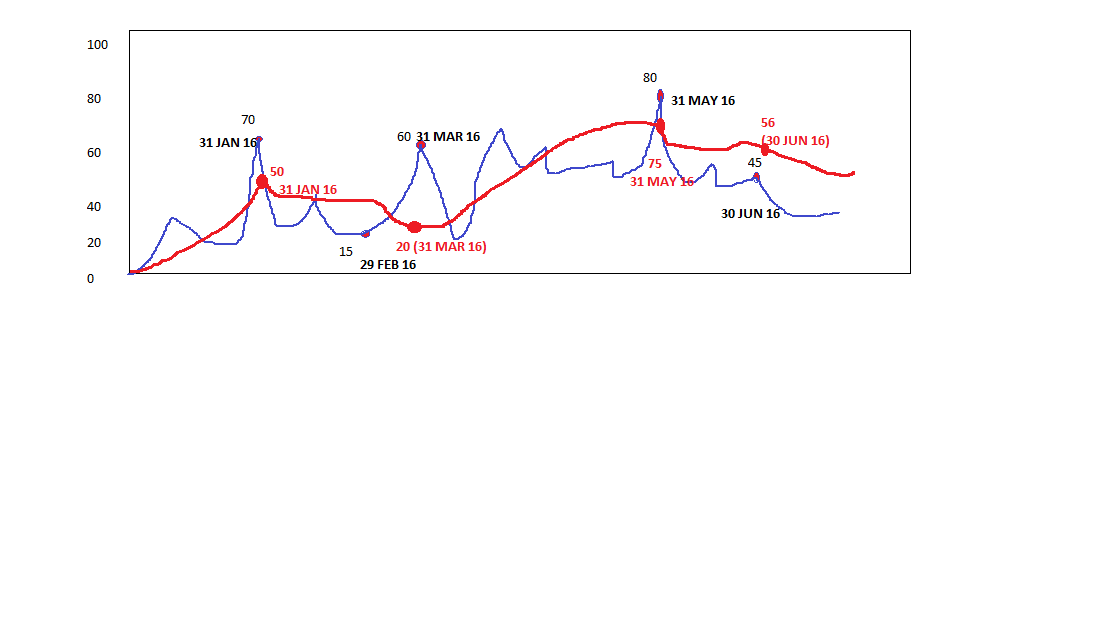
Accepted Solutions
- Mark as New
- Bookmark
- Subscribe
- Mute
- Subscribe to RSS Feed
- Permalink
- Report Inappropriate Content
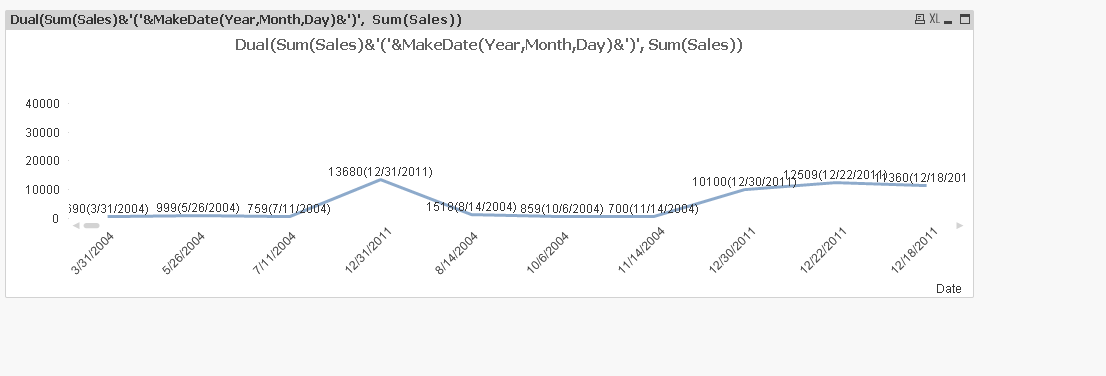
I dont have date dimension in the sample data, if you have date
then use your expression as
Dual(Sum(Sales)&'('&DateDimension&')', Sum(Sales))
- Mark as New
- Bookmark
- Subscribe
- Mute
- Subscribe to RSS Feed
- Permalink
- Report Inappropriate Content
In Qliksense this is not possible , the regular dual function doesn't work
- Mark as New
- Bookmark
- Subscribe
- Mute
- Subscribe to RSS Feed
- Permalink
- Report Inappropriate Content
Hi,
Sorry tagged wrongly to Sense. This requirement is for QlikView.
Changed the tagging now.
- Mark as New
- Bookmark
- Subscribe
- Mute
- Subscribe to RSS Feed
- Permalink
- Report Inappropriate Content
Then it is possible,
Some thing like this
- Mark as New
- Bookmark
- Subscribe
- Mute
- Subscribe to RSS Feed
- Permalink
- Report Inappropriate Content
I dont have date dimension in the sample data, if you have date
then use your expression as
Dual(Sum(Sales)&'('&DateDimension&')', Sum(Sales))