Unlock a world of possibilities! Login now and discover the exclusive benefits awaiting you.
- Qlik Community
- :
- All Forums
- :
- QlikView App Dev
- :
- Re: Dimension limits in a Chart ?
- Subscribe to RSS Feed
- Mark Topic as New
- Mark Topic as Read
- Float this Topic for Current User
- Bookmark
- Subscribe
- Mute
- Printer Friendly Page
- Mark as New
- Bookmark
- Subscribe
- Mute
- Subscribe to RSS Feed
- Permalink
- Report Inappropriate Content
Dimension limits in a Chart ?
In a bar chart, there are 3 choices under dimension limits, when "Restrict which values are displayed using the first expression" -
1) "Show only" :: First, Largest,Smallest :: x values
2) "Show only values that are" :: Greater than, Less than, Greater than or equal to, or Less than or equal a value.
3) "Show only values that accumulate to" ...
What is the meaning of 2 and 3 ?
- Mark as New
- Bookmark
- Subscribe
- Mute
- Subscribe to RSS Feed
- Permalink
- Report Inappropriate Content
Hi John,
just read all there is to seee in the dialog.
2) "Show values that are {individually} [greater than] [x%] ... of total sum"
=> Only values that are individually (e.g.) greater than 5% of your total will be shown
3) "Accumulation of values" ... [relative to total sum]
=> Only just so many values will be shown until (e.g.) 80% of your total are reached.
=> In both cases, there are so many options with the two dropdown menus, it's like Starbucks' "chochochino latte grande creamy decaf" - I cannot tell you exactly what you'll get when selecting any combination, just try it out.
HTH
Best regards,
DataNibbler
- Mark as New
- Bookmark
- Subscribe
- Mute
- Subscribe to RSS Feed
- Permalink
- Report Inappropriate Content
from online help
"
Show only values that are:
Select this option to display all dimensions values that meet the specified condition for this option. Select to display values based on a percentage of the total, or on an exact amount. The relative to the total option enables a relative mode which is similar to the Relative option on the Expressions tab of the property dialog. The value may be entered as a calculated formula. Click on the ... button to open the Edit Expression Dialog.
Show only values that accumulate to:
When this option is selected,all rows up to the current row are accumulated, and the result is compared to the value set in the option. The relative to the total option enables a relative mode which is similar to the Relative option on the Expressions tab of the property dialog, and compares the accumulated values (based on first, largest or smallest values) to the overall total. The value may be entered as a calculated formula. Click on the ... button to open the Edit Expression Dialog. Select Include Boundary Values to include the dimension value that contains the comparison value.
Note!
Negative values will not be included when calculating the accumulated restriction sum. We recommend that you don't use relative restrictions for fields that can contain negative values.
"
or see attachment
- Mark as New
- Bookmark
- Subscribe
- Mute
- Subscribe to RSS Feed
- Permalink
- Report Inappropriate Content
thanks. Please put the attachment.
- Mark as New
- Bookmark
- Subscribe
- Mute
- Subscribe to RSS Feed
- Permalink
- Report Inappropriate Content
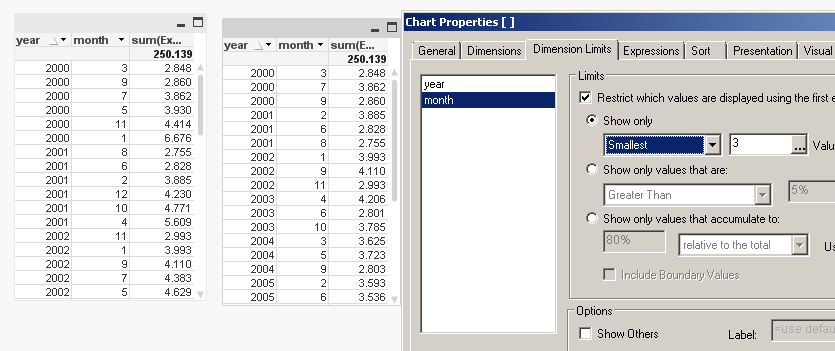
Hi , can you apply this to only show the last 3 months in a year
- Mark as New
- Bookmark
- Subscribe
- Mute
- Subscribe to RSS Feed
- Permalink
- Report Inappropriate Content
last = smallest?

- Mark as New
- Bookmark
- Subscribe
- Mute
- Subscribe to RSS Feed
- Permalink
- Report Inappropriate Content
Hi,
And is there any "elegant" way to limt 3 months back from current and 10 months forward?
- Mark as New
- Bookmark
- Subscribe
- Mute
- Subscribe to RSS Feed
- Permalink
- Report Inappropriate Content
The difference between the second and the third options is that the former evaluates
the individual result corresponding to the dimension's value, while the latter
evaluates the cumulative total of that value by either sweeping from largest to
smallest or vice versa. This can be used, for instance, in a Pareto analysis