Unlock a world of possibilities! Login now and discover the exclusive benefits awaiting you.
- Qlik Community
- :
- All Forums
- :
- QlikView App Dev
- :
- Re: Display Aggregated Count per Week on a Table C...
- Subscribe to RSS Feed
- Mark Topic as New
- Mark Topic as Read
- Float this Topic for Current User
- Bookmark
- Subscribe
- Mute
- Printer Friendly Page
- Mark as New
- Bookmark
- Subscribe
- Mute
- Subscribe to RSS Feed
- Permalink
- Report Inappropriate Content
Display Aggregated Count per Week on a Table Chart
Hi, I would like to ask if it's possible to create a table chart that aggregates the count of an equipment per classification on a weekly basis.
Supposedly I have a table with the following data:
Equipment, Classification, Week
Equip_1, Class_1, 201701
Equip_2, Class_1, 201701
Equip_3, Class_2, 201701
Equip_4, Class_4, 201701
Equip_5, Class_2, 201701
Equip_1, Class_2, 201702
Equip_2, Class_1, 201702
Equip_3, Class_2, 201702
Equip_4, Class_4, 201702
Equip_5, Class_3, 201702
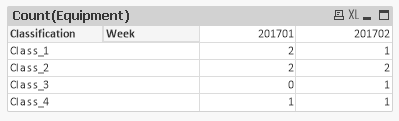
I want to display this in a table chart like this:
| Classification | 201701 | 201702 |
|---|---|---|
| Class_1 | 2 | 1 |
| Class_2 | 2 | 2 |
| Class_3 | 0 | 1 |
| Class_4 | 1 | 1 |
Thanks in advance!
Accepted Solutions
- Mark as New
- Bookmark
- Subscribe
- Mute
- Subscribe to RSS Feed
- Permalink
- Report Inappropriate Content
- Mark as New
- Bookmark
- Subscribe
- Mute
- Subscribe to RSS Feed
- Permalink
- Report Inappropriate Content
Like this?
- Mark as New
- Bookmark
- Subscribe
- Mute
- Subscribe to RSS Feed
- Permalink
- Report Inappropriate Content
Use, Pivot table with the expression of Count(Equipment) and Dim as Classification & Week. Then transpose to Row for Week