Unlock a world of possibilities! Login now and discover the exclusive benefits awaiting you.
- Qlik Community
- :
- All Forums
- :
- QlikView App Dev
- :
- Re: Display last 6 values in line chart based on s...
- Subscribe to RSS Feed
- Mark Topic as New
- Mark Topic as Read
- Float this Topic for Current User
- Bookmark
- Subscribe
- Mute
- Printer Friendly Page
- Mark as New
- Bookmark
- Subscribe
- Mute
- Subscribe to RSS Feed
- Permalink
- Report Inappropriate Content
Display last 6 values in line chart based on selection.
Hi Team,
I need to display last six years from the selected year in line chart(year as dimension).
It is working fine with the following expression:
avg({< Year = {"<=$(=max(Year))>=$(=max(Year) - 6)"} >} QUALITY_SCORE)
But, as per the requirement, i need the following expression:
If([Field Category]='Base (Required)' and Model='First Submissions', avg(aggr(avg({<Year = {"<=$(=max(Year))>=$(=max(Year) - 6)"} >} QUALITY_SCORE), [File Type],Year)))
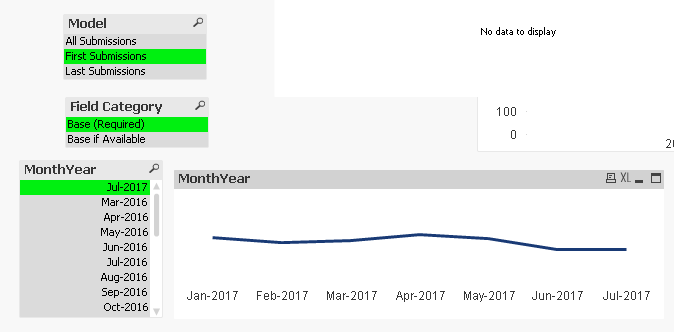
if i use this expression, it is showing only selected year in line chart but not last six years.
Please do the needful.
- Mark as New
- Bookmark
- Subscribe
- Mute
- Subscribe to RSS Feed
- Permalink
- Report Inappropriate Content
Hi Sunny,
I tried this. But, it is taking the month values which are greater than selected month. We are supposed to get last six months from selected month.@stalwar1
- Mark as New
- Bookmark
- Subscribe
- Mute
- Subscribe to RSS Feed
- Permalink
- Report Inappropriate Content
Also, is there any way to make it work for last 6 Quarter values? @stalwar1
- Mark as New
- Bookmark
- Subscribe
- Mute
- Subscribe to RSS Feed
- Permalink
- Report Inappropriate Content
I left an extra parenthesis in there... try this
If(
Only(TOTAL {<MonthYear = {">=$(=date(MonthStart(max(MonthYear), -6),'MMM-YYYY'))<=$(=date(max(MonthYear),'MMM-YYYY'))"}>} [Field Category]) = 'Base (Required)' and
Only(TOTAL {<MonthYear = {">=$(=date(MonthStart(max(MonthYear), -6),'MMM-YYYY'))<=$(=date(max(MonthYear),'MMM-YYYY'))"}>} Model) = 'First Submissions',
Avg({<MonthYear = {">=$(=date(MonthStart(max(MonthYear), -6),'MMM-YYYY'))<=$(=date(max(MonthYear),'MMM-YYYY'))"}>} Aggr(Avg({<MonthYear = {">=$(=date(MonthStart(max(MonthYear), -6),'MMM-YYYY'))<=$(=date(max(MonthYear),'MMM-YYYY'))"}>} BASE_MODEL_A_QUALITY_SCORE), [File Type], MonthYear)))
- Mark as New
- Bookmark
- Subscribe
- Mute
- Subscribe to RSS Feed
- Permalink
- Report Inappropriate Content
For last 6 quarter, may be go back 18 months rather than just 6 months
If(
Only(TOTAL {<MonthYear = {">=$(=date(MonthStart(max(MonthYear), -18),'MMM-YYYY'))<=$(=date(max(MonthYear),'MMM-YYYY'))"}>} [Field Category]) = 'Base (Required)' and
Only(TOTAL {<MonthYear = {">=$(=date(MonthStart(max(MonthYear), -18),'MMM-YYYY'))<=$(=date(max(MonthYear),'MMM-YYYY'))"}>} Model) = 'First Submissions',
Avg({<MonthYear = {">=$(=date(MonthStart(max(MonthYear), -18),'MMM-YYYY'))<=$(=date(max(MonthYear),'MMM-YYYY'))"}>} Aggr(Avg({<MonthYear = {">=$(=date(MonthStart(max(MonthYear), -18),'MMM-YYYY'))<=$(=date(max(MonthYear),'MMM-YYYY'))"}>} BASE_MODEL_A_QUALITY_SCORE), [File Type], MonthYear)))
- Mark as New
- Bookmark
- Subscribe
- Mute
- Subscribe to RSS Feed
- Permalink
- Report Inappropriate Content
Hi @stalwar1
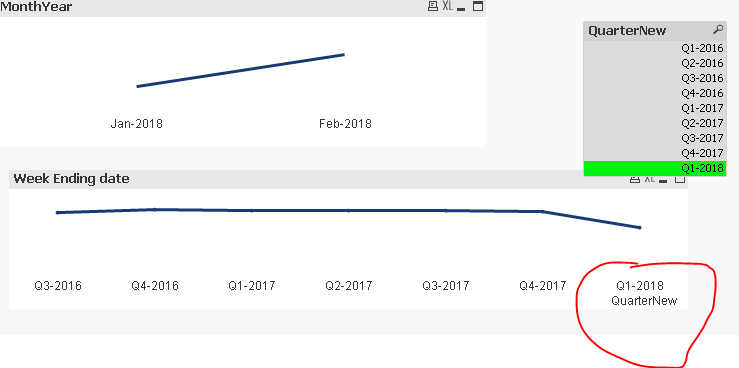
MonthYear is working fine. But for Quarter, chart is displaying only one quater upon selecting the quarter value. It should display last 6 quarters from selected quarter. Please look into it.
- Mark as New
- Bookmark
- Subscribe
- Mute
- Subscribe to RSS Feed
- Permalink
- Report Inappropriate Content
You really need to look into and learn set analysis my friend... try this
If(
Only(TOTAL {<MonthYear = {">=$(=date(MonthStart(max(MonthYear), -18),'MMM-YYYY'))<=$(=date(max(MonthYear),'MMM-YYYY'))"}, QuarterNew>} [Field Category]) = 'Base (Required)' and
Only(TOTAL {<MonthYear = {">=$(=date(MonthStart(max(MonthYear), -18),'MMM-YYYY'))<=$(=date(max(MonthYear),'MMM-YYYY'))"}, QuarterNew>} Model) = 'First Submissions',
Avg({<MonthYear = {">=$(=date(MonthStart(max(MonthYear), -18),'MMM-YYYY'))<=$(=date(max(MonthYear),'MMM-YYYY'))"}, QuarterNew>} Aggr(Avg({<MonthYear = {">=$(=date(MonthStart(max(MonthYear), -18),'MMM-YYYY'))<=$(=date(max(MonthYear),'MMM-YYYY'))"}, QuarterNew>} BASE_MODEL_A_QUALITY_SCORE), [File Type], MonthYear)))
Now I hope there is nothing more you want to add here and if this works you would close this thread by marking correct and helpful responses above.
Best,
Sunny
- Mark as New
- Bookmark
- Subscribe
- Mute
- Subscribe to RSS Feed
- Permalink
- Report Inappropriate Content
Thank you very much sunny. i tried this. the chart is not taking Q1-2018. Except that it is working fine.
- Mark as New
- Bookmark
- Subscribe
- Mute
- Subscribe to RSS Feed
- Permalink
- Report Inappropriate Content
I am not sure what that means? I tried the above expression and it seems to be showing Q1-2018
- Mark as New
- Bookmark
- Subscribe
- Mute
- Subscribe to RSS Feed
- Permalink
- Report Inappropriate Content
Hi @Sunny Talwar
When we select Q1-2018 from Quarter list box, the chart should display Q1-2018, Q4-2017, Q3-2017, Q2-2017,Q1-2017 AND Q4-2016.
But, its not displaying Q1-2018.Please see the attached screenshot.
- Mark as New
- Bookmark
- Subscribe
- Mute
- Subscribe to RSS Feed
- Permalink
- Report Inappropriate Content
I am seeing it... I am not sure what you have... may be attach your qvw again