Unlock a world of possibilities! Login now and discover the exclusive benefits awaiting you.
- Qlik Community
- :
- All Forums
- :
- QlikView App Dev
- :
- Displaying cvs file in a table box with no columns
- Subscribe to RSS Feed
- Mark Topic as New
- Mark Topic as Read
- Float this Topic for Current User
- Bookmark
- Subscribe
- Mute
- Printer Friendly Page
- Mark as New
- Bookmark
- Subscribe
- Mute
- Subscribe to RSS Feed
- Permalink
- Report Inappropriate Content
Displaying cvs file in a table box with no columns
I have output from a market basket analysis (MBA) from R which has been saved as a CSV file and the output is as follows:

The last three columns in the CSV file above represent the support, confidence and lift values of the MBA results. The rest of the output is the rules.
I need to display the above in a table box through a load script so that it comes out with no columns and appear as something like as below:

The lift has not been shown on the above example.
I tried the following load statement:

The MBAOutputRow is used as field to display for the table box. The output of the exercise is as follows:

How can this be improved to give the desired results resembling the image given earlier on ?
Regards.
- Mark as New
- Bookmark
- Subscribe
- Mute
- Subscribe to RSS Feed
- Permalink
- Report Inappropriate Content
Hi Christopher,
if you don't load the individual fields, it's going to be REALLY hard to present them well aligned like in your example, - because the source strings are not aligned.
So, if this file is tab-separated, load the fields separately and then present them the way you wanted to. Otherwise, you'd have to parse the strings using a bunch of goofy rules, like for example looking for the first, second, and third occurrences of the ' 0.' string (that's assuming that none of your numbers should ever reach 1).
I'd try hard to find a way of loading this data into separate fields, then the rest is a lot easier.
cheers,
Oleg Troyansky
Upgrade your Qlik skills at the Masters Summit for Qlik - coming soon to Milan, Italy and Austin, TX!
- Mark as New
- Bookmark
- Subscribe
- Mute
- Subscribe to RSS Feed
- Permalink
- Report Inappropriate Content
Hi Oleg
Thank you very much for your input, most appreciated.
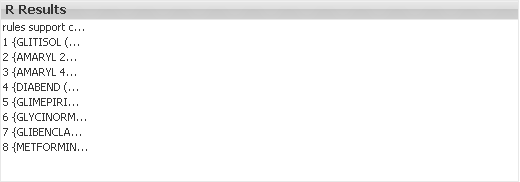
What i ended above doing was to change the R format of the CSV file to a single format and no separators. The result is as follows:

At least i am somewhere but not perfect.
Regards
Chris