Unlock a world of possibilities! Login now and discover the exclusive benefits awaiting you.
- Qlik Community
- :
- All Forums
- :
- QlikView App Dev
- :
- Divide all elements of a series by its last value
- Subscribe to RSS Feed
- Mark Topic as New
- Mark Topic as Read
- Float this Topic for Current User
- Bookmark
- Subscribe
- Mute
- Printer Friendly Page
- Mark as New
- Bookmark
- Subscribe
- Mute
- Subscribe to RSS Feed
- Permalink
- Report Inappropriate Content
Divide all elements of a series by its last value
Hi All
I have calucated data to look at the evolution of the loss ratio:
Month, AY 2008, AY 2009
1, 25%, 30%
2, 40%, 40%
3, 36%, 60%
4, 19%, 70%
5, 50%, 65%
6, 60%, 61%
....
48, 65%, 59%
I would now like to state everything in % of the end value, I would like to calculate for month 1 to 48 everything in a percentage of month 48.
How do I do that?
Many thanks for your help.
Best regards,
Jan
Accepted Solutions
- Mark as New
- Bookmark
- Subscribe
- Mute
- Subscribe to RSS Feed
- Permalink
- Report Inappropriate Content
Depending on how you've done this, you may be able to use the Bottom() function directly to get this value.
If you can't (which may be the case in some situations), the alternative approach is probably to use FirstSortedValue() and aggr(). However, using Bottom() is much easier so if your use case allows it, that's better.
- Mark as New
- Bookmark
- Subscribe
- Mute
- Subscribe to RSS Feed
- Permalink
- Report Inappropriate Content
explain little bit more.
max(Month) always give you max month number.
You can try like
sum({<Month={"$(=max(Month))"}>}Sales)
Regards
Please appreciate our Qlik community members by giving Kudos for sharing their time for your query. If your query is answered, please mark the topic as resolved 🙂
- Mark as New
- Bookmark
- Subscribe
- Mute
- Subscribe to RSS Feed
- Permalink
- Report Inappropriate Content
Normally, Calendar having only 12 months? Not really sure what do you mean below one
I would now like to state everything in % of the end value, I would like to calculate for month 1 to 48 everything in a percentage of month 48.
As my understand this?
Month, AY 2008, AY 2009
1, 25%, 30%
2, 40%, 40%
3, 36%, 60%
4, 19%, 70%
5, 50%, 65%
6, 60%, 61%
....
48, 65%, 59%
Perhaps this?
Sum(Measure) / Sum({<Month = {$(=Max(Month))}>}Measure)
- Mark as New
- Bookmark
- Subscribe
- Mute
- Subscribe to RSS Feed
- Permalink
- Report Inappropriate Content
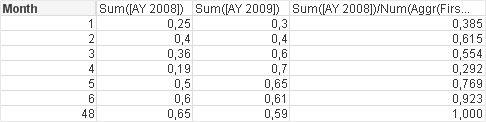
May be like this
Sum([AY 2008])/Num(Aggr(FirstSortedValue(TOTAL [AY 2008],-Month),Month))
- Mark as New
- Bookmark
- Subscribe
- Mute
- Subscribe to RSS Feed
- Permalink
- Report Inappropriate Content
Hi
Are you talking about months or week as there are only 12 months and isn't the percentage of month 48 should be 100% when compared to itself ? Can you be a little more specific?
- Mark as New
- Bookmark
- Subscribe
- Mute
- Subscribe to RSS Feed
- Permalink
- Report Inappropriate Content
Hi Or
Many thanks, that yields the correct values in my table.
Now I have in the table as the first dimension on the y-axis the month and the x-axis the years. The data is calculated with the formula sum(claims)/sum(premium)/bottom(sum(claims)/sum(premium)).
However, when I want it to transform into a line chart, having the months on the x-axis, it takes the year (2009) as the bottom and expresses everything in terms of 2009.
How do I manage to preserve the month as the argument of the bottom function?
Many thanks.
- Mark as New
- Bookmark
- Subscribe
- Mute
- Subscribe to RSS Feed
- Permalink
- Report Inappropriate Content
The accident year evolves over more than just 12 months because claims may arrive in month 16 or 28 as a function of the coverage.
When I do it like you proposed I get one single point with 100%. Months and years collapse.
Many thanks.
- Mark as New
- Bookmark
- Subscribe
- Mute
- Subscribe to RSS Feed
- Permalink
- Report Inappropriate Content
The accident year provides coverage for 12 months however, claims might arrive later/^be reduced or reported later. Hence, after 18 month the claims might still increase.
I want to express the evolution of the loss ratio in terms of months since the beginning of the accident year.
The loss ratio is calculated sum(claims)/sum(earned premium). After 12 months the sum(earned premium) becomes constant, but claims might change in month 18 or 27 (reduction due to claims management, more information arrive...).
- Mark as New
- Bookmark
- Subscribe
- Mute
- Subscribe to RSS Feed
- Permalink
- Report Inappropriate Content
I'm not entirely sure - if your dimension is months, why is it taking the year as the bottom value? It should use the same dimension as the chart, by definition, so if your only dimension is months it should use that.
If you can't get Bottom() to behave, you will have to go with the approach explained above by Antonio using FirstSortedValue() and Aggr(), or the one suggested by Anil using set analysis. It isn't entirely clear to me what the expected outcome is, so I'm not entirely sure how you'd write out the specific formulas.