Unlock a world of possibilities! Login now and discover the exclusive benefits awaiting you.
- Qlik Community
- :
- All Forums
- :
- QlikView App Dev
- :
- Re: Drill Down Tables
- Subscribe to RSS Feed
- Mark Topic as New
- Mark Topic as Read
- Float this Topic for Current User
- Bookmark
- Subscribe
- Mute
- Printer Friendly Page
- Mark as New
- Bookmark
- Subscribe
- Mute
- Subscribe to RSS Feed
- Permalink
- Report Inappropriate Content
Drill Down Tables
The user wants to be able to click on 3 different columns in a summary straight table and make one of 3 different detail tables pop up. How do I set triggers to do this? 
- Mark as New
- Bookmark
- Subscribe
- Mute
- Subscribe to RSS Feed
- Permalink
- Report Inappropriate Content
You could place a conditional hide/show on each of the objects. For example for the first table you would add a condition like
=GetSelectedCount("YOURFIELD") >= 1
You could then add to the logic as you move down the tables. Only draw back is that if you happen to be using the same fields that you are stating the conditions as filters/list boxes on the same tab then you could run into the tables appearing when you don't want them to.
- Mark as New
- Bookmark
- Subscribe
- Mute
- Subscribe to RSS Feed
- Permalink
- Report Inappropriate Content
Hi,
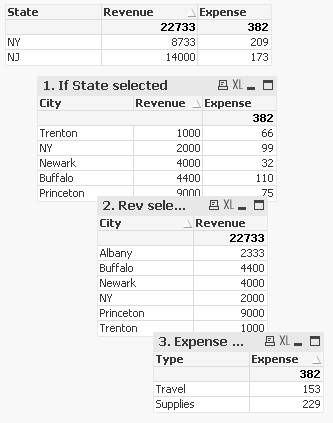
Possible with State Selections.
Not directly possible with others as Qlik Does not support Expression Selections but there are work arounds you can place a text object in place of Expression Name ans set variable to show that particular Chart.
Hope it helps
Regards
ASHFAQ
- Mark as New
- Bookmark
- Subscribe
- Mute
- Subscribe to RSS Feed
- Permalink
- Report Inappropriate Content
Check for Dimension Solution
Regards
ASHFAQ
- Mark as New
- Bookmark
- Subscribe
- Mute
- Subscribe to RSS Feed
- Permalink
- Report Inappropriate Content
Hi
Check the Attach