Unlock a world of possibilities! Login now and discover the exclusive benefits awaiting you.
- Qlik Community
- :
- All Forums
- :
- QlikView App Dev
- :
- Re: Dynamic step value to get $ symbol in Y axis f...
- Subscribe to RSS Feed
- Mark Topic as New
- Mark Topic as Read
- Float this Topic for Current User
- Bookmark
- Subscribe
- Mute
- Printer Friendly Page
- Mark as New
- Bookmark
- Subscribe
- Mute
- Subscribe to RSS Feed
- Permalink
- Report Inappropriate Content
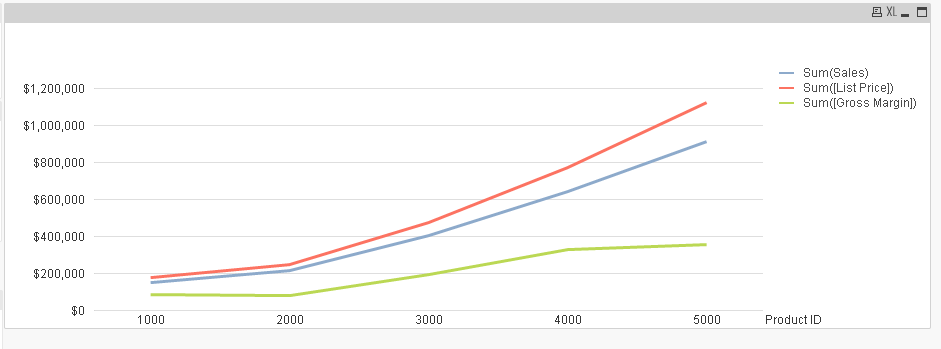
Dynamic step value to get $ symbol in Y axis for line chart
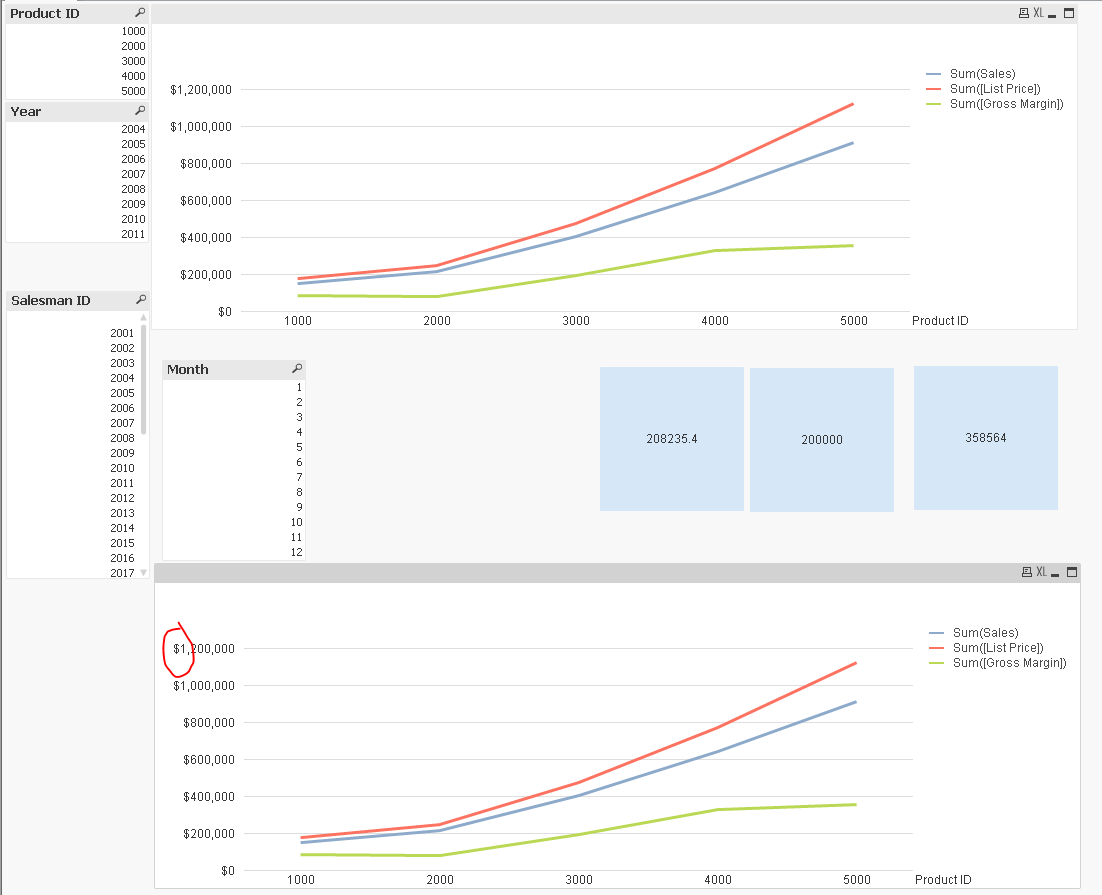
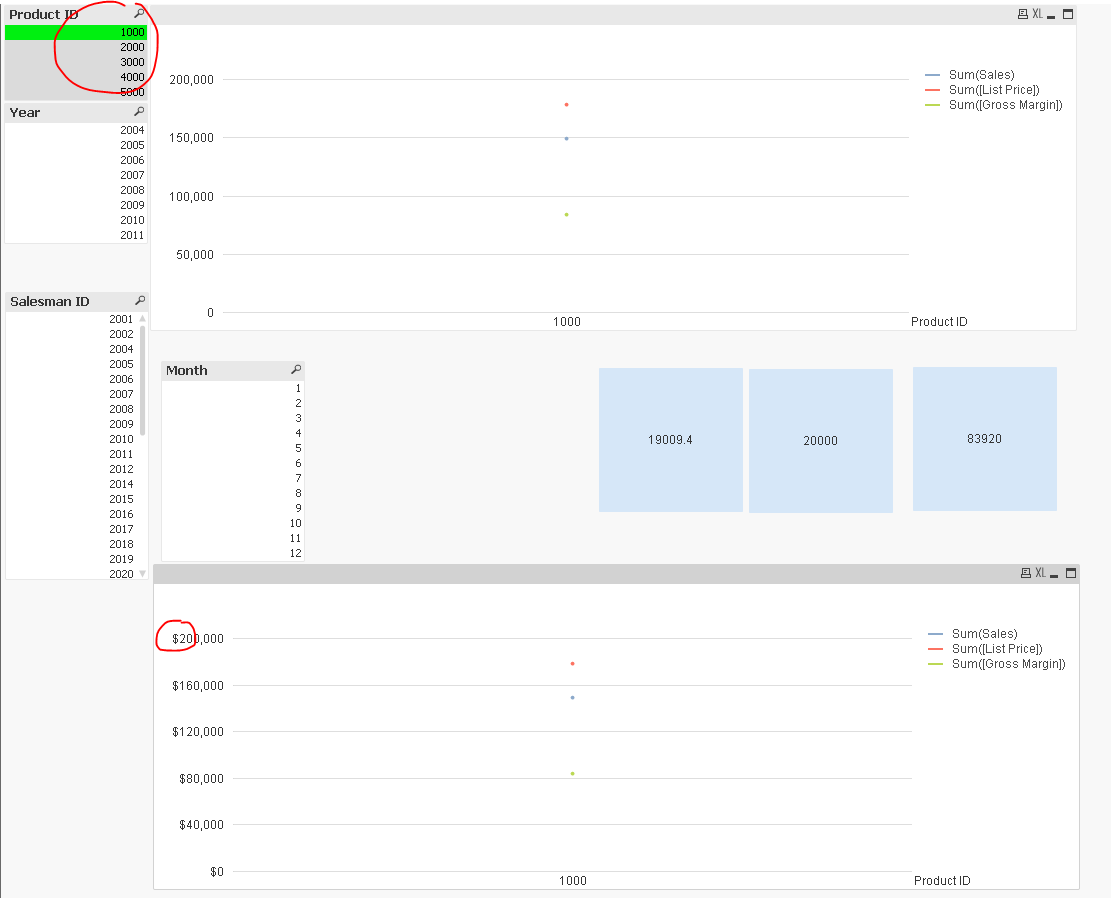
I have a requirement to show $ value in the Y axis and came to know a trick using Step value in axis tab this is working fine till no filter values are selected as a value from salesmanID is selected the value which I kept in the step value(1000000) is not applying to the graph Y axis, so I am just thinking how to get a meaningful step value dynamically.
Attaching a sample qvw for some data
- « Previous Replies
-
- 1
- 2
- Next Replies »
Accepted Solutions
- Mark as New
- Bookmark
- Subscribe
- Mute
- Subscribe to RSS Feed
- Permalink
- Report Inappropriate Content
May be this
=Round((
Max(Aggr(Sum([List Price]), [Product ID]))
-Min(Aggr(Sum([List Price]), [Product ID])))/5, pow(10, RangeMax(Len(Floor((Max(Aggr(Sum([List Price]), [Product ID]))
-Min(Aggr(Sum([List Price]), [Product ID])))/5))-1, 1)))
or this
=Round((Max(Aggr(Sum([List Price]), [Product ID])))/5, pow(10, RangeMax(Len(Floor((Max(Aggr(Sum([List Price]), [Product ID])))/5))-1, 1)))
- Mark as New
- Bookmark
- Subscribe
- Mute
- Subscribe to RSS Feed
- Permalink
- Report Inappropriate Content
May be this
=Round((RangeMax(
Max(Aggr(Sum(Sales), [Product ID])),
Max(Aggr(Sum([List Price]), [Product ID])),
Max(Aggr(Sum([Gross Margin]), [Product ID])))
-RangeMin(
Min(Aggr(Sum(Sales), [Product ID])),
Min(Aggr(Sum([List Price]), [Product ID])),
Min(Aggr(Sum([Gross Margin]), [Product ID]))))/5, pow(10, RangeMax(Len(Floor((RangeMax(
Max(Aggr(Sum(Sales), [Product ID])),
Max(Aggr(Sum([List Price]), [Product ID])),
Max(Aggr(Sum([Gross Margin]), [Product ID])))
-RangeMin(
Min(Aggr(Sum(Sales), [Product ID])),
Min(Aggr(Sum([List Price]), [Product ID])),
Min(Aggr(Sum([Gross Margin]), [Product ID]))))/5))-1, 1)))
- Mark as New
- Bookmark
- Subscribe
- Mute
- Subscribe to RSS Feed
- Permalink
- Report Inappropriate Content
Hi Sunny,
thanks much for the quick help, if we remove the two expressions for List Price, Gross Margin from the chart
can you please redefine the expression for StepValue as I stated you in another post my original requirement even though it contains four expression the Y axis scales are based on the Forecast value which is always higher than other three so I think there is no need to consider the other three expression
- Mark as New
- Bookmark
- Subscribe
- Mute
- Subscribe to RSS Feed
- Permalink
- Report Inappropriate Content
May be this
=Round((
Max(Aggr(Sum([List Price]), [Product ID]))
-Min(Aggr(Sum([List Price]), [Product ID])))/5, pow(10, RangeMax(Len(Floor((Max(Aggr(Sum([List Price]), [Product ID]))
-Min(Aggr(Sum([List Price]), [Product ID])))/5))-1, 1)))
or this
=Round((Max(Aggr(Sum([List Price]), [Product ID])))/5, pow(10, RangeMax(Len(Floor((Max(Aggr(Sum([List Price]), [Product ID])))/5))-1, 1)))
- Mark as New
- Bookmark
- Subscribe
- Mute
- Subscribe to RSS Feed
- Permalink
- Report Inappropriate Content
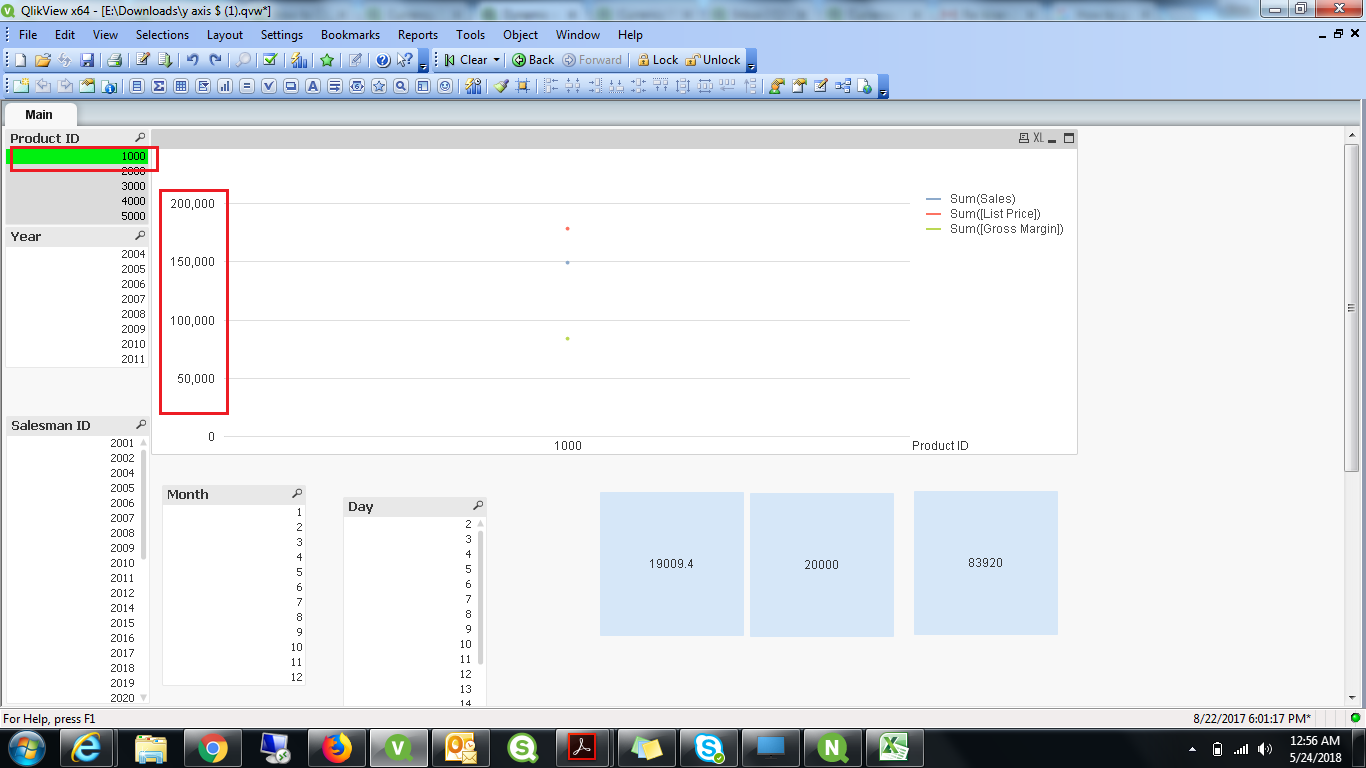
I just checked on the productID filters the $ was missing
- Mark as New
- Bookmark
- Subscribe
- Mute
- Subscribe to RSS Feed
- Permalink
- Report Inappropriate Content
I am seeing the $, are you not?
- Mark as New
- Bookmark
- Subscribe
- Mute
- Subscribe to RSS Feed
- Permalink
- Report Inappropriate Content
I guess use this
=Round((Max(Aggr(Sum([List Price]), [Product ID])))/5, pow(10, RangeMax(Len(Floor((Max(Aggr(Sum([List Price]), [Product ID])))/5))-1, 1)))
- Mark as New
- Bookmark
- Subscribe
- Mute
- Subscribe to RSS Feed
- Permalink
- Report Inappropriate Content
I checked with your second expression this seems to be working
need to incorporate this to my thing , will let you know
The first expression was not working for me
- Mark as New
- Bookmark
- Subscribe
- Mute
- Subscribe to RSS Feed
- Permalink
- Report Inappropriate Content
Yes that is because Max - Min of List Price is 0 when Max and Min are equal 
- Mark as New
- Bookmark
- Subscribe
- Mute
- Subscribe to RSS Feed
- Permalink
- Report Inappropriate Content
For generalized expression, it all started here
- « Previous Replies
-
- 1
- 2
- Next Replies »