Unlock a world of possibilities! Login now and discover the exclusive benefits awaiting you.
- Qlik Community
- :
- All Forums
- :
- QlikView App Dev
- :
- Expression to calculate sales before given date an...
- Subscribe to RSS Feed
- Mark Topic as New
- Mark Topic as Read
- Float this Topic for Current User
- Bookmark
- Subscribe
- Mute
- Printer Friendly Page
- Mark as New
- Bookmark
- Subscribe
- Mute
- Subscribe to RSS Feed
- Permalink
- Report Inappropriate Content
Expression to calculate sales before given date and after date
Hi
In the below chart I want to have sell through before date(start date as given in image) and sell through (after end date )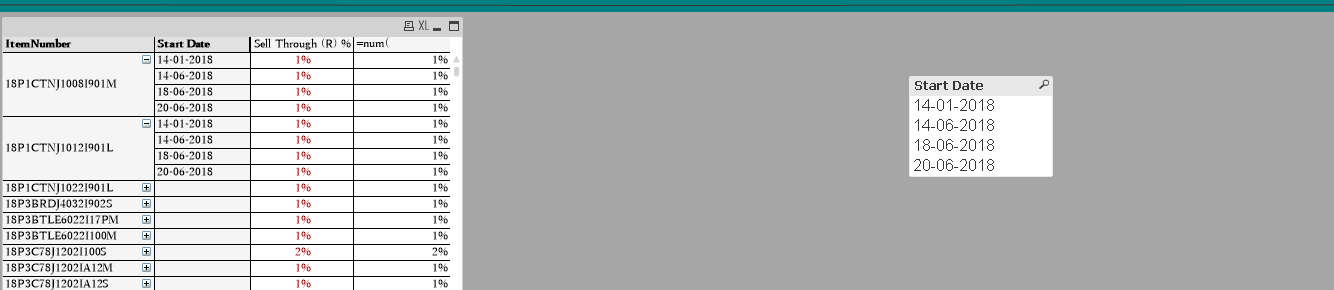
Following expression i have used for Sell Through before (start date to end date )
=num(
(sum( {< Sold_Date = {"<=$(Start Date)<=$(End Date)"},[Season Code] = {$(Master_CurrentSeason)} >} quantity_sold)- sum( {< Sold_Date = {">=$(Start Date)<=$(End Date)"}, [Season Code] = {$(Master_CurrentSeason)} >} quantity_returns))
/
sum( {$<[Season Code] = {$(Master_CurrentSeason)} >} quantity_received),'#,##0%')
Following expression i have used for Sell Through till date (start date to end date )
=num(
(sum( {< Sold_Date = {">=$(Start Date)<=$(End Date)"},[Season Code] = {$(Master_CurrentSeason)} >} quantity_sold)- sum( {< Sold_Date = {">=$(Start Date)<=$(End Date)"}, [Season Code] = {$(Master_CurrentSeason)} >} quantity_returns))
/
sum( {$<[Season Code] = {$(Master_CurrentSeason)} >} quantity_received)
,
'#,##0%')
Note here start and end date are present in inline table not a calender dates
Above expressions are giving incorrect results
Regards
Sakshi
- Mark as New
- Bookmark
- Subscribe
- Mute
- Subscribe to RSS Feed
- Permalink
- Report Inappropriate Content
Hi sakshi,
can you provide a sample app and expected out put?
Thanks
- Mark as New
- Bookmark
- Subscribe
- Mute
- Subscribe to RSS Feed
- Permalink
- Report Inappropriate Content
Hi Sakshi,
Can you share sample Application and expected results?
Best Regards,
Ashok