Unlock a world of possibilities! Login now and discover the exclusive benefits awaiting you.
Announcements
FLASH SALE: Save $500! Use code FLASH2026 at checkout until Feb 14th at 11:59PM ET. Register Now!
- Qlik Community
- :
- All Forums
- :
- QlikView App Dev
- :
- Re: Expression
Options
- Subscribe to RSS Feed
- Mark Topic as New
- Mark Topic as Read
- Float this Topic for Current User
- Bookmark
- Subscribe
- Mute
- Printer Friendly Page
Turn on suggestions
Auto-suggest helps you quickly narrow down your search results by suggesting possible matches as you type.
Showing results for
Creator II
2018-03-19
03:21 AM
- Mark as New
- Bookmark
- Subscribe
- Mute
- Subscribe to RSS Feed
- Permalink
- Report Inappropriate Content
Expression
Hi,
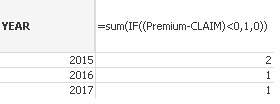
I have attached sampale QV document with two pivot tables in it. IN my 2nd Pivot table I want to show no of Polcies if there is a negative figure in Profit Figure. I want to display following table
| YEAR | count |
| 2015 | 2 |
| 2016 | 1 |
| 2017 | 1 |
but it actually shows only 2015 year. Can you pls help me
429 Views
1 Solution
Accepted Solutions
MVP
2018-03-19
03:30 AM
- Mark as New
- Bookmark
- Subscribe
- Mute
- Subscribe to RSS Feed
- Permalink
- Report Inappropriate Content
Use this for 2nd pivot table
Dimension
YEAR
expression
SUM(Aggr(IF(SUM(Premium)-SUM(CLAIM)<0,1,0),POLICY_NO,NAME,YEAR))
371 Views
2 Replies
MVP
2018-03-19
03:30 AM
- Mark as New
- Bookmark
- Subscribe
- Mute
- Subscribe to RSS Feed
- Permalink
- Report Inappropriate Content
Use this for 2nd pivot table
Dimension
YEAR
expression
SUM(Aggr(IF(SUM(Premium)-SUM(CLAIM)<0,1,0),POLICY_NO,NAME,YEAR))
372 Views
Anonymous
Not applicable
2018-03-19
03:54 AM
- Mark as New
- Bookmark
- Subscribe
- Mute
- Subscribe to RSS Feed
- Permalink
- Report Inappropriate Content
Hi ,
you could just tweek your expression a little
=sum(IF((Premium-CLAIM)<0,1,0))
371 Views