Unlock a world of possibilities! Login now and discover the exclusive benefits awaiting you.
- Qlik Community
- :
- All Forums
- :
- QlikView App Dev
- :
- Re: Extension for Number with in Circle (Badge Col...
- Subscribe to RSS Feed
- Mark Topic as New
- Mark Topic as Read
- Float this Topic for Current User
- Bookmark
- Subscribe
- Mute
- Printer Friendly Page
- Mark as New
- Bookmark
- Subscribe
- Mute
- Subscribe to RSS Feed
- Permalink
- Report Inappropriate Content
Extension for Number with in Circle (Badge Color)
Hi All,
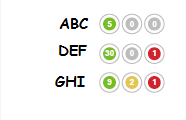
I am looking for an extension object for an report object in Qlikview in which I can show number within color circle in pivot report as shown below.
Can anyone create or if they already have, request you to share with me.
In bottom image you can see right now, there are 3 rows but in future it might increase so am going to use pivot report but unable to achieve the right side portion.
Thanks in Advance
Neetu
- Tags:
- extension_objects
- « Previous Replies
-
- 1
- 2
- Next Replies »
Accepted Solutions
- Mark as New
- Bookmark
- Subscribe
- Mute
- Subscribe to RSS Feed
- Permalink
- Report Inappropriate Content
- Mark as New
- Bookmark
- Subscribe
- Mute
- Subscribe to RSS Feed
- Permalink
- Report Inappropriate Content
Might check here and see if any of them will work:
- Mark as New
- Bookmark
- Subscribe
- Mute
- Subscribe to RSS Feed
- Permalink
- Report Inappropriate Content
Thanks William.
But am looking something for Pivot or straight table. As you can see in image that one side we have user name & another side we have data corresponding to that user.
And it should be dynamic because number of user can increase.
- Mark as New
- Bookmark
- Subscribe
- Mute
- Subscribe to RSS Feed
- Permalink
- Report Inappropriate Content
- Mark as New
- Bookmark
- Subscribe
- Mute
- Subscribe to RSS Feed
- Permalink
- Report Inappropriate Content
Hi William,
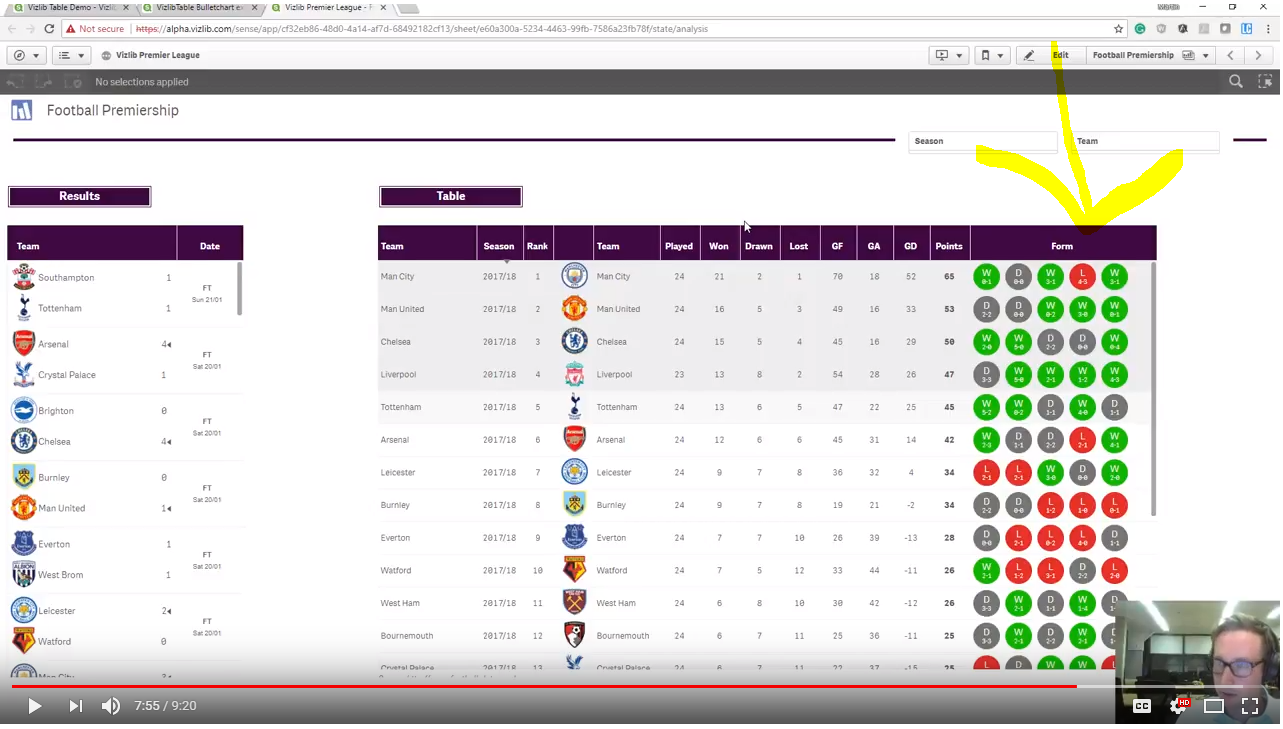
Yes this is what I want (which is shown in "Form" column) but I guess this is in qliksense & i need this in qlikview not in sense.
Is it possible that I can use this extension object within qlikview.
If yes, can you please help me to explain/ share the extension object .
Your help really appreciated.
- Mark as New
- Bookmark
- Subscribe
- Mute
- Subscribe to RSS Feed
- Permalink
- Report Inappropriate Content
Hi,
for small numbers you could use some unicode characters:
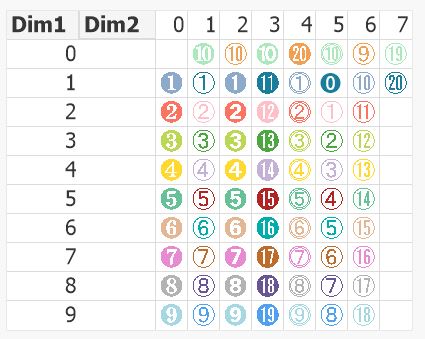
table1:
LOAD *,
    Mod(AutoNumber(Code),10) as Dim1,
    Div(AutoNumber(Code),10) as Dim2;
LOAD *,
    Num(Ord(Char),'(HEX)') as Code
Inline [
    Char
    ❶
    ❷
    ❸
    ❹
    ❺
    ❻
    ❼
    ❽
    ❾
    ❿
    ➀
    ➁
    ➂
    ➃
    ➄
    ➅
    ➆
    ➇
    ➈
    ➉
    ➊
    ➋
    ➌
    ➍
    ➎
    ➏
    ➐
    ➑
    ➒
    ➓
    ⓫
    ⓬
    ⓭
    ⓮
    ⓯
    ⓰
    ⓱
    ⓲
    ⓳
    ⓴
    ⓵
    ⓶
    ⓷
    ⓸
    ⓹
    ⓺
    ⓻
    ⓼
    ⓽
    ⓾
    ⓿
    ①
    ②
    ③
    ④
    ⑤
    ⑥
    ⑦
    ⑧
    ⑨
    ⑩
    ⑪
    ⑫
    ⑬
    ⑭
    ⑮
    ⑯
    ⑰
    ⑱
    ⑲
    ⑳
];
hope this helps
regards
Marco
- Mark as New
- Bookmark
- Subscribe
- Mute
- Subscribe to RSS Feed
- Permalink
- Report Inappropriate Content
Hi Marco,
Yeah i need something like this but can you please help me to create this by using attached sample data.
There are 2 sheet in the attached excel file.
1) Data input- this is how i have data in my source table.
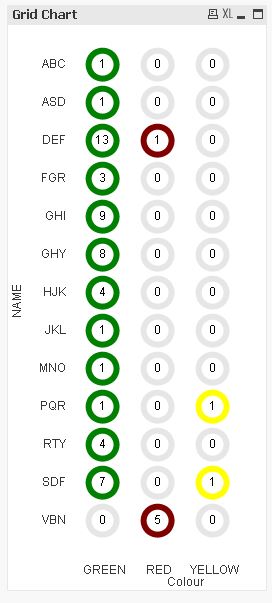
2) OUTPUT- in this sheet i have created 3 section Green/Yellow/Red. T !he behavior is in Green section, if number is greater than 0 then it should be within green circle & if it is 0 then it should be in "Gray" circle.
Thanks & your help really appreciated.
Neetu
- Mark as New
- Bookmark
- Subscribe
- Mute
- Subscribe to RSS Feed
- Permalink
- Report Inappropriate Content
Hi,
I didn't quite get the logic to transform your input into your required output, but once it's given, you might be able to implement some logic on top e.g. like this:

mapCircNum:
Mapping
LOAD IterNo()-1,
    Dual(Mid(CircledNumber,IterNo(),1),IterNo()-1)
Inline [
    CircledNumber
    ⓪①②③④⑤⑥⑦⑧⑨⑩⑪⑫⑬⑭⑮⑯⑰⑱⑲⑳㉑㉒㉓㉔㉕㉖㉗㉘㉙㉚㉛㉜㉝㉞㉟㊱㊲㊳㊴㊵㊶㊷㊸㊹㊺㊻㊼㊽㊾㊿
] While IterNo()<=Len(CircledNumber);

table1:
CrossTable (Colour, DataTemp)
LOAD * FROM [https://community.qlik.com/servlet/JiveServlet/download/1538454-336856/TEST%20DATA.xls] (biff, embedded labels, table is OUTPUT$);

table2:
LOAD NAME,
    Dual(Colour,Evaluate(Colour&'()')) as Colour,
    ApplyMap('mapCircNum',DataTemp) as Data
Resident table1;

DROP Table table1;
hope this helps
regards
Marco
- Mark as New
- Bookmark
- Subscribe
- Mute
- Subscribe to RSS Feed
- Permalink
- Report Inappropriate Content
Marco,
Thank you so much. Will try to implement this on my data.
I had two questions.
1) The only method is to write it on script ? Since i need it dynamic. is this the only way ?
2) How are you writing these (bringing) this type . ❶ ❷ Using ASCI or something ?
i need this one specially (❶ ❷).
Thanks
Neetu
- Mark as New
- Bookmark
- Subscribe
- Mute
- Subscribe to RSS Feed
- Permalink
- Report Inappropriate Content
My name isn't Marco but I think I can give you an answer as well .... 
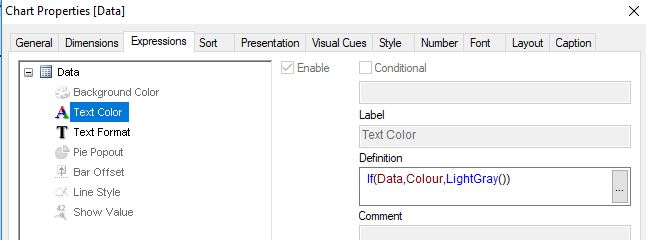
- No there isn't - you can also easily do it dynamically in the UI without doing anything in the load script. Have a look at the attached QlikView application I made. I just made two variables - with some strange looking names and reference them with $-sign expansion before and after the expression or number I want to convert to numbers with circled digits.
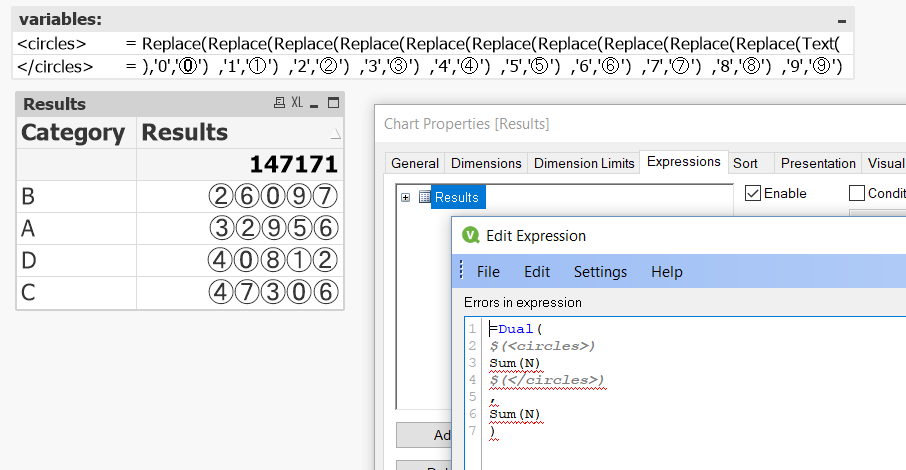
You don't have to use Dual() here - I just used it to be able to still use the number in calculations in the chart for other expressions and or totals. You could simply have $(<circles>) Sum(N) $(</circles>) - No ASCII is not used but a relative or successor if you like of ASCII which is Unicode or the specific Unicode character set named UTF-8. Original US ASCII had only 127 characters Unicode has in version 6.0 109.384 characters mapped and can possibly contain more than a million different characters (later on).
Using Chr() function in QlikView or Qlik Sense you can give the Unicode character number which can be quite high numbers.
This web site is a place where you can explore the Unicode characters:
https://unicode-table.com/en/search/?q=negative+circled
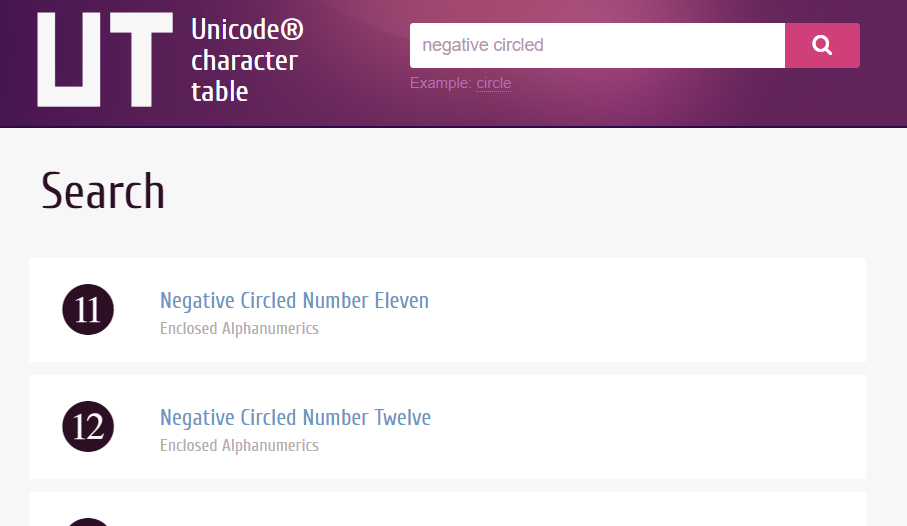
There are many of these helpful sites out there that let you explore the universe of Unicode... Just google Unicode and UTF8 and you will find this one as well: Unicode Character Ranges as tens of others ...
- « Previous Replies
-
- 1
- 2
- Next Replies »