Unlock a world of possibilities! Login now and discover the exclusive benefits awaiting you.
- Qlik Community
- :
- All Forums
- :
- QlikView App Dev
- :
- Filter by on expression
- Subscribe to RSS Feed
- Mark Topic as New
- Mark Topic as Read
- Float this Topic for Current User
- Bookmark
- Subscribe
- Mute
- Printer Friendly Page
- Mark as New
- Bookmark
- Subscribe
- Mute
- Subscribe to RSS Feed
- Permalink
- Report Inappropriate Content
Filter by on expression
I have a single chart as this one:
Customer A **************** 35 %
Customer B ************** 30 %
Customer C ******** 10 %
Customer D ***** 7 %
...
PCT Discount expression is some thing like sum( discount ) / ( sum( price ) + sum( discount ) )
At this time, I want to filter chart to see only clients with a PCT Discount < X. How can I create a slider object to select X ?
This is my first question. Sorry if I have contravened any etiquette rule.
Accepted Solutions
- Mark as New
- Bookmark
- Subscribe
- Mute
- Subscribe to RSS Feed
- Permalink
- Report Inappropriate Content
Hi Daniel,
First, if you want to use a slider object, you must create a variable.
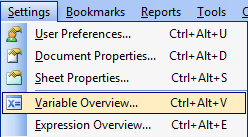
So, go to Settings / Variable overview and add a new variable called vLimit.
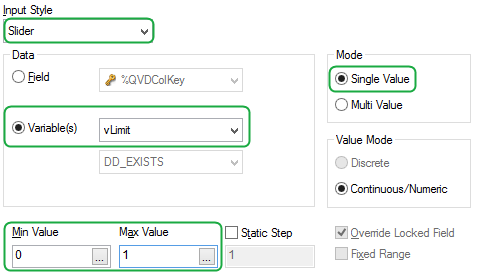
After that, you have to create a new "Slider / Calendar object".
Let the input type as slider, choose your variable and set the options like in the picture.
Hope that helps you,
Martin Favier
- Mark as New
- Bookmark
- Subscribe
- Mute
- Subscribe to RSS Feed
- Permalink
- Report Inappropriate Content
Hi Daniel,
First, if you want to use a slider object, you must create a variable.
So, go to Settings / Variable overview and add a new variable called vLimit.
After that, you have to create a new "Slider / Calendar object".
Let the input type as slider, choose your variable and set the options like in the picture.
Hope that helps you,
Martin Favier
- Mark as New
- Bookmark
- Subscribe
- Mute
- Subscribe to RSS Feed
- Permalink
- Report Inappropriate Content
Thanks Martin,
runs like a charm:
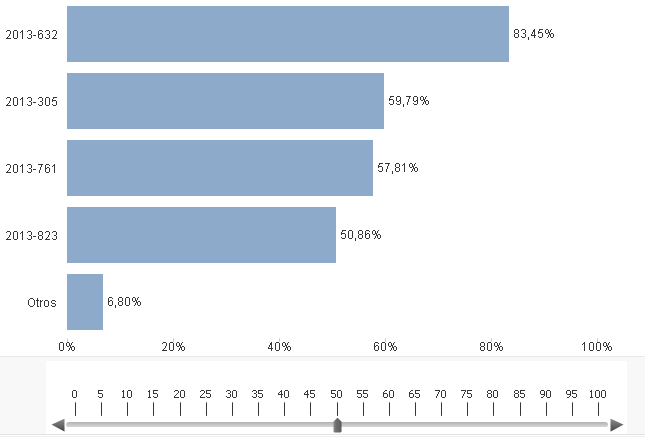
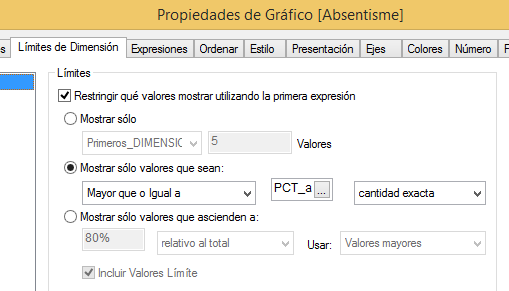
Also important to set limit to var in chart limits dimension properties:
daniel.