Unlock a world of possibilities! Login now and discover the exclusive benefits awaiting you.
- Qlik Community
- :
- All Forums
- :
- QlikView App Dev
- :
- Re: Filtered data
- Subscribe to RSS Feed
- Mark Topic as New
- Mark Topic as Read
- Float this Topic for Current User
- Bookmark
- Subscribe
- Mute
- Printer Friendly Page
- Mark as New
- Bookmark
- Subscribe
- Mute
- Subscribe to RSS Feed
- Permalink
- Report Inappropriate Content
Filtered data
Hello community!
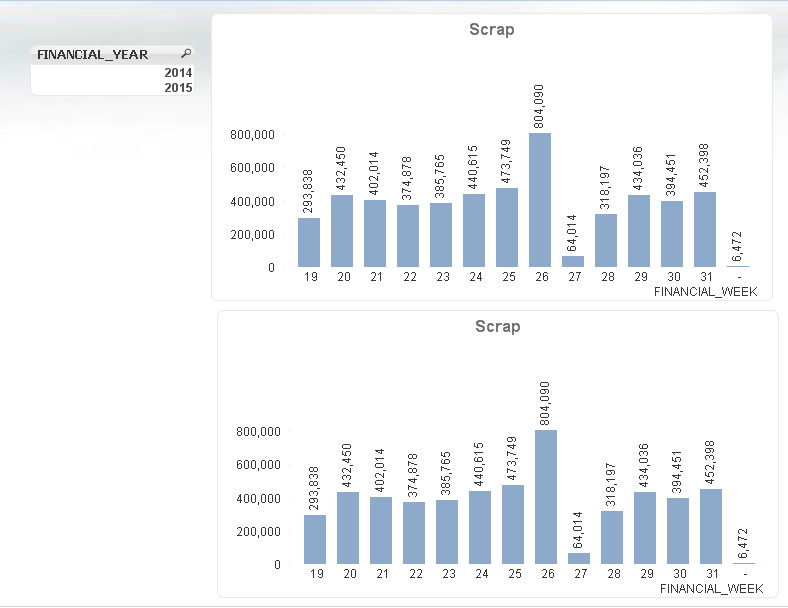
I have a sheet with the two charts below and a listbox. I would like the top chart defaulted to the years 2015, but able to be changed to 2014 if I want. I would like the bottom chart to not be filtered at all. Does anyone know how I can do this?
Thanks!

Accepted Solutions
- Mark as New
- Bookmark
- Subscribe
- Mute
- Subscribe to RSS Feed
- Permalink
- Report Inappropriate Content
For the top chart use the following expression:
Sum({<FINANCIAL_YEAR = {'$(=Max(FINANCIAL_YEAR ))'}>} Sales)
This will show max FINANCIAL_YEAR when you have nothing selected and will show the max FINANCIAL_YEAR for the selected list of FINANCIAL_YEAR
Below chart, use this:
Sum({<FINANCIAL_YEAR}>} Sales)
This will not let the expression changed based on any selection in FINANCIAL_YEAR list box and will always show all years
Note: Sum(Sales) was just an example, you just need to add the red part to your expressions.
- Mark as New
- Bookmark
- Subscribe
- Mute
- Subscribe to RSS Feed
- Permalink
- Report Inappropriate Content
Thanks a lot!
- Mark as New
- Bookmark
- Subscribe
- Mute
- Subscribe to RSS Feed
- Permalink
- Report Inappropriate Content
Not a problem ![]()
- Mark as New
- Bookmark
- Subscribe
- Mute
- Subscribe to RSS Feed
- Permalink
- Report Inappropriate Content
Hi Channing, you can do this:
1. Right click in your sheet
2. Properties
3. Triggers
4. Click in -> Sheet Event Triggers -> OnActivateSheet -> Edit Action(s)...
5. Add an action: "Select in Field"
6. Fill the Field with: FINANCIAL_YEAR
7. Fill the Search String with: 2015
8. Ok and close
In this way, every time that you see this sheet, the value of default of FINANCIAL_YEAR will be 2015.
I hope that it help you,
Regards, Agustin